WeightWatchers 2011 Annual Report Download - page 50
Download and view the complete annual report
Please find page 50 of the 2011 WeightWatchers annual report below. You can navigate through the pages in the report by either clicking on the pages listed below, or by using the keyword search tool below to find specific information within the annual report.-
 1
1 -
2
-
3
-
4
-
5
-
6
-
7
-
8
-
9
-
10
-
11
-
12
-
13
-
14
-
15
-
16
-
17
-
18
-
19
-
20
-
21
-
22
-
23
-
24
-
25
-
26
-
27
-
28
-
29
-
30
-
31
-
32
-
33
-
34
-
35
-
36
-
37
-
38
-
39
-
 40
40 -
 41
41 -
 42
42 -
 43
43 -
 44
44 -
 45
45 -
 46
46 -
 47
47 -
 48
48 -
 49
49 -
 50
50 -
 51
51 -
 52
52 -
 53
53 -
 54
54 -
 55
55 -
 56
56 -
 57
57 -
 58
58 -
 59
59 -
 60
60 -
61
-
62
-
63
-
64
-
65
-
66
-
67
-
68
-
69
-
70
-
71
-
72
-
73
-
74
-
75
-
76
-
77
-
78
-
79
-
80
-
81
-
82
-
83
-
84
-
85
-
86
-
87
-
88
-
89
-
90
-
91
-
92
-
93
-
94
-
95
-
96
-
97
-
98
-
99
-
100
-
101
-
102
-
103
-
104
-
105
-
106
-
107
-
108
-
109
-
110
-
111
-
112
-
113
-
114
-
115
-
116
-
117
-
118
-
119
-
120
-
121
-
122
-
123
-
124
-
125
-
126
-
127
-
128
-
129
-
130
 |
 |

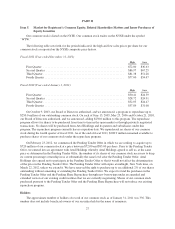
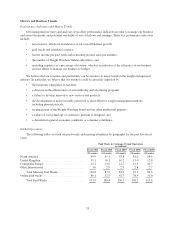
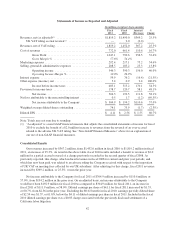
The following table sets forth our revenues by category for the past five fiscal years.
Revenue Sources
(in millions)
Fiscal 2011 Fiscal 2010 Fiscal 2009 Fiscal 2008 Fiscal 2007
(52 weeks) (52 weeks) (52 weeks) (53 weeks) (52 weeks)
Meetings fees ................................ $ 990.3 $ 819.6 $ 817.5 $ 908.1 $ 880.7
In-meeting product sales ....................... 281.8 260.5 251.3 285.6 281.1
Internet revenues ............................. 399.5 238.8 196.0 185.8 151.6
Licensing, franchise royalties and other ........... 147.6 133.1 134.1 156.3 153.8
Total ....................................... $1,819.2 $1,452.0 $1,398.9 $1,535.8 $1,467.2
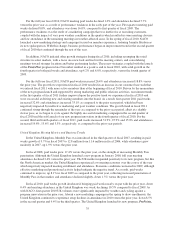
From fiscal 2007 through fiscal 2011, our revenues increased at a compound annual growth rate of 5.5%,
principally due to paid weeks growth in both our meetings and WeightWatchers.com businesses:
•Meeting fees. From fiscal 2007 through fiscal 2011, meeting fees grew at a compound annual growth
rate of 3.0% led by our NACO operations. This increase was driven by growth in our meeting paid
weeks, which grew on a global basis at a compound annual growth rate of 5.5%. The decline in
meeting fees from 2008 to 2009 primarily reflects the impact of the global recession on our ability to
enroll new members. Beginning in NACO in the second quarter of fiscal 2010, year-over-year growth
in recruitment trends, driven by strong new marketing and further fueled by the soft launch of
ProPoints in our English-speaking markets, drove global meeting fees in the fourth quarter of fiscal
2010 to once again increase versus the comparable prior year period. In fiscal 2011, we saw a larger
than typical number of new members, who had never previously been Weight Watchers customers,
coming into the brand. The momentum of the new program launches in our English-speaking markets
accelerated our recruitment trends in the first quarter of fiscal 2011, and, supported by strong
marketing and public relations, resulted in global meeting fees that increased in every quarter of fiscal
2011 as compared to the prior year period.
•In-meeting product sales. Global product sales were essentially flat, up 0.1% on a compound annual
growth rate from fiscal 2007 through fiscal 2011. While the average product sales per attendee in our
meetings business grew from $4.48 to $4.94 during that period as the result of successful new product
and program launches, a compound annual growth rate of 2.5%, we experienced a decline in the
number of members attending meetings.
•WeightWatchers.com. From fiscal 2007 through fiscal 2011, our Internet revenues grew at a compound
annual growth rate of 27.4%. The increase was primarily due to growth in the number of
WeightWatchers.com end of period active Online subscribers which grew by over 1 million from
583,900 at the end of fiscal 2007 to 1,586,000 at the end of fiscal 2011. This increase in Online
subscribers drove growth in our Online paid weeks, which grew 30.2% on a compounded annual
growth rate. This increase in Online subscribers and paid weeks, which accelerated in fiscal 2011, was
driven primarily by continued strong marketing campaigns which began in the second quarter of fiscal
2010 in the United States and the United Kingdom, and further benefited from the new program
launches at the end of fiscal 2010. In addition, sign-ups grew in Continental Europe from fiscal 2007
through fiscal 2011 primarily due to new launches in several of our markets.
•Licensing revenues. Licensing revenues grew modestly at a compound annual growth rate of 0.6%
from fiscal 2007 through fiscal 2011. Despite our increased focus on expanding the number of Weight
Watchers branded and endorsed products worldwide, this revenue category was and remains negatively
impacted by the global recession.
32