WeightWatchers 2011 Annual Report Download - page 66
Download and view the complete annual report
Please find page 66 of the 2011 WeightWatchers annual report below. You can navigate through the pages in the report by either clicking on the pages listed below, or by using the keyword search tool below to find specific information within the annual report.-
 1
1 -
2
-
3
-
4
-
5
-
6
-
7
-
8
-
9
-
10
-
11
-
12
-
13
-
14
-
15
-
16
-
17
-
18
-
19
-
20
-
21
-
22
-
23
-
24
-
25
-
26
-
27
-
28
-
29
-
30
-
31
-
32
-
33
-
34
-
35
-
36
-
37
-
38
-
39
-
40
-
41
-
42
-
43
-
44
-
45
-
46
-
47
-
48
-
49
-
50
-
51
-
52
-
53
-
54
-
55
-
 56
56 -
 57
57 -
 58
58 -
 59
59 -
 60
60 -
 61
61 -
 62
62 -
 63
63 -
 64
64 -
 65
65 -
 66
66 -
 67
67 -
 68
68 -
 69
69 -
 70
70 -
 71
71 -
 72
72 -
 73
73 -
 74
74 -
 75
75 -
 76
76 -
77
-
78
-
79
-
80
-
81
-
82
-
83
-
84
-
85
-
86
-
87
-
88
-
89
-
90
-
91
-
92
-
93
-
94
-
95
-
96
-
97
-
98
-
99
-
100
-
101
-
102
-
103
-
104
-
105
-
106
-
107
-
108
-
109
-
110
-
111
-
112
-
113
-
114
-
115
-
116
-
117
-
118
-
119
-
120
-
121
-
122
-
123
-
124
-
125
-
126
-
127
-
128
-
129
-
130
 |
 |

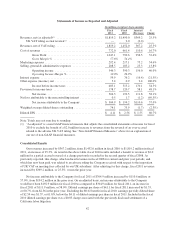
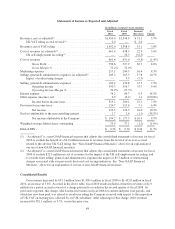
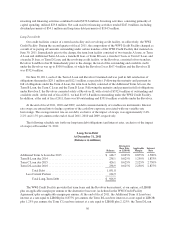
Statements of Income as Reported and Adjusted
(In millions, except per share amounts)
Fiscal
2010
Fiscal
2009
Increase/
(Decrease)
%
Change
Revenues, net (as adjusted)(1) ............................... $1,450.0 $1,398.9 $ 51.1 3.7%
UK VAT ruling accrual reversal(1) ....................... 2.0 — $ 2.0
Revenues, net of VAT ruling ................................ 1,452.0 1,398.9 53.1 3.8%
Cost of revenues (as adjusted)(2) ............................. 661.4 638.5 22.9 3.6%
UK self-employment tax ruling(2) ........................ — 32.5 (32.5)
Cost of revenues ......................................... 661.4 671.0 (9.5) (1.4%)
Gross Profit ..................................... 790.6 727.9 62.7 8.6%
Gross Margin % ................................. 54.4% 52.0%
Marketing expenses ....................................... 217.1 200.5 16.6 8.3%
Selling, general & administrative expenses (as adjusted)(2) ........ 183.2 165.3 17.8 10.7%
Impact of restructuring charges .......................... — 5.5 (5.5)
Selling, general & administrative expenses .................... 183.2 170.8 12.3 7.2%
Operating income ................................ 390.3 356.7 33.7 9.4%
Operating Income Margin % ........................ 26.9% 25.5%
Interest expense .......................................... 76.2 66.7 9.5 14.2%
Other expense (income), net ................................ 0.9 (0.2) 1.1 (100.0%)
Income before income taxes ........................ 313.2 290.1 23.1 7.9%
Provision for income taxes ................................. 120.7 115.6 5.1 4.4%
Net income ...................................... 192.5 174.5 18.0 10.3%
Net loss attributable to the noncontrolling interest ............... 1.7 2.8 (1.1) (38.2%)
Net income attributable to the Company ............... $ 194.2 $ 177.3 $ 16.9 9.5%
Weighted average diluted shares outstanding ................... 75.9 77.1 (1.2) (1.6%)
Diluted EPS ............................................. $ 2.56 $ 2.30 $ 0.26 11.3%
(1) “As adjusted” is a non-GAAP financial measure that adjusts the consolidated statements of income for fiscal
2010 to exclude the benefit of a $2.0 million increase to revenues from the reversal of an over-accrual
related to the adverse UK VAT ruling. See “Non-GAAP Financial Measures” above for an explanation of
our use of non-GAAP financial measures.
(2) “As adjusted” is a non-GAAP financial measure that adjusts the consolidated statements of income for fiscal
2009 to exclude $32.5 million in cost of revenues for the impact of the UK self-employment tax ruling, and
to exclude from selling, general and administrative expenses the impact of $5.5 million of restructuring
charges associated with our previously disclosed cost savings initiatives. See “Non-GAAP Financial
Measures” above for an explanation of our use of non-GAAP financial measures.
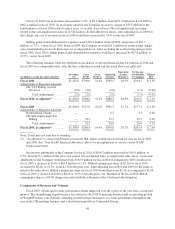
Consolidated Results
Our revenues increased by $53.1 million from $1,398.9 million in fiscal 2009 to $1,452.0 million in fiscal
2010, an increase of 3.8%. As noted in the above table, fiscal 2010 results included a benefit to revenue of $2.0
million for a partial accrual reversal of a charge previously recorded in the second quarter of fiscal 2008. As
previously reported, this charge, which reduced revenues in fiscal 2008 for current and prior year periods, and
which has now been paid, was related to an adverse ruling the Company received with respect to the imposition
of UK VAT on meeting fees collected by our UK subsidiary. After adjusting for this charge, 2010 revenues
increased by $51.1 million, or 3.7%, versus the prior year.
48