WeightWatchers 2011 Annual Report Download - page 109
Download and view the complete annual report
Please find page 109 of the 2011 WeightWatchers annual report below. You can navigate through the pages in the report by either clicking on the pages listed below, or by using the keyword search tool below to find specific information within the annual report.-
 1
1 -
2
-
3
-
4
-
5
-
6
-
7
-
8
-
9
-
10
-
11
-
12
-
13
-
14
-
15
-
16
-
17
-
18
-
19
-
20
-
21
-
22
-
23
-
24
-
25
-
26
-
27
-
28
-
29
-
30
-
31
-
32
-
33
-
34
-
35
-
36
-
37
-
38
-
39
-
40
-
41
-
42
-
43
-
44
-
45
-
46
-
47
-
48
-
49
-
50
-
51
-
52
-
53
-
54
-
55
-
56
-
57
-
58
-
59
-
60
-
61
-
62
-
63
-
64
-
65
-
66
-
67
-
68
-
69
-
70
-
71
-
72
-
73
-
74
-
75
-
76
-
77
-
78
-
79
-
80
-
81
-
82
-
83
-
84
-
85
-
86
-
87
-
88
-
89
-
90
-
91
-
92
-
93
-
94
-
95
-
96
-
97
-
98
-
 99
99 -
 100
100 -
 101
101 -
 102
102 -
 103
103 -
 104
104 -
 105
105 -
 106
106 -
 107
107 -
 108
108 -
 109
109 -
 110
110 -
 111
111 -
 112
112 -
 113
113 -
 114
114 -
 115
115 -
 116
116 -
 117
117 -
 118
118 -
 119
119 -
120
-
121
-
122
-
123
-
124
-
125
-
126
-
127
-
128
-
129
-
130
 |
 |

WEIGHT WATCHERS INTERNATIONAL, INC. AND SUBSIDIARIES
NOTES TO CONSOLIDATED FINANCIAL STATEMENTS
(IN THOUSANDS, EXCEPT PER SHARE AMOUNTS)
Year Ended January 2, 2010
WWI WW.com
Intercompany
Eliminations Consolidated
Revenues from external customers .................... $1,201,123 $197,790 $ 0 $1,398,913
Intercompany revenue .............................. 18,793 0 (18,793) 0
Total revenue ................................ $1,219,916 $197,790 $ (18,793) $1,398,913
Depreciation and amortization ....................... $ 25,088 $ 4,884 $ 0 $ 29,972
Operating income ................................. $ 293,382 $ 63,268 $ 0 $ 356,650
Interest expense ............................... 66,722
Other income, net ............................. (228)
Provision for taxes ............................ 115,585
Net income ...................................... $ 174,571
Total assets ...................................... $1,202,767 $179,049 $(294,307) $1,087,509
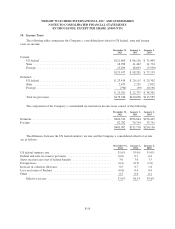
The following table presents information about the Company’s sources of revenue and other information by
geographic area. There were no material amounts of sales or transfers among geographic areas and no material
amounts of US export sales.
Revenues for the Year Ended
December 31,
2011
January 1,
2011
January 2,
2010
NACO meeting fees ......................................... $ 686,758 $ 545,289 $ 546,957
International Company-owned meeting fees ...................... 303,538 274,357 270,566
Product sales ............................................... 334,303 304,961 292,086
Franchise royalties .......................................... 14,461 12,133 13,078
Internet revenues ............................................ 399,495 238,756 195,985
Other ..................................................... 80,601 76,541 80,241
$1,819,156 $1,452,037 $1,398,913
Revenues for the Year Ended
December 31,
2011
January 1,
2011
January 2,
2010
North America ............................................. $1,261,277 $ 957,598 $ 915,789
United Kingdom ............................................ 192,903 176,714 178,579
Continental Europe .......................................... 231,377 250,844 248,773
Australia, New Zealand and other .............................. 133,599 66,881 55,772
$1,819,156 $1,452,037 $1,398,913
Long-Lived Assets
December 31,
2011
January 1,
2011
January 2,
2010
North America ............................................. $ 845,197 $ 830,422 $ 832,012
United Kingdom ............................................ 19,067 18,535 17,015
Continental Europe .......................................... 8,437 7,506 6,931
Australia, New Zealand and other .............................. 19,870 21,718 21,703
$ 892,571 $ 878,181 $ 877,661
F-25