WeightWatchers 2011 Annual Report Download - page 129
Download and view the complete annual report
Please find page 129 of the 2011 WeightWatchers annual report below. You can navigate through the pages in the report by either clicking on the pages listed below, or by using the keyword search tool below to find specific information within the annual report.-
 1
1 -
2
-
3
-
4
-
5
-
6
-
7
-
8
-
9
-
10
-
11
-
12
-
13
-
14
-
15
-
16
-
17
-
18
-
19
-
20
-
21
-
22
-
23
-
24
-
25
-
26
-
27
-
28
-
29
-
30
-
31
-
32
-
33
-
34
-
35
-
36
-
37
-
38
-
39
-
40
-
41
-
42
-
43
-
44
-
45
-
46
-
47
-
48
-
49
-
50
-
51
-
52
-
53
-
54
-
55
-
56
-
57
-
58
-
59
-
60
-
61
-
62
-
63
-
64
-
65
-
66
-
67
-
68
-
69
-
70
-
71
-
72
-
73
-
74
-
75
-
76
-
77
-
78
-
79
-
80
-
81
-
82
-
83
-
84
-
85
-
86
-
87
-
88
-
89
-
90
-
91
-
92
-
93
-
94
-
95
-
96
-
97
-
98
-
99
-
100
-
101
-
102
-
103
-
104
-
105
-
106
-
107
-
108
-
109
-
110
-
111
-
112
-
113
-
114
-
115
-
116
-
117
-
118
-
 119
119 -
 120
120 -
 121
121 -
 122
122 -
 123
123 -
 124
124 -
 125
125 -
 126
126 -
 127
127 -
 128
128 -
 129
129 -
 130
130
 |
 |

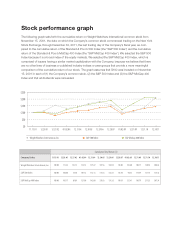
Stock performance graph
The following graph sets forth the cumulative return on Weight Watchers International common stock from
November 15, 2001, the date on which the Company’s common stock commenced trading on the New York
Stock Exchange, through December 30, 2011, the last trading day of the Company’s fi scal year, as com-
pared to the cumulative return of the Standard & Poor’s 500 Index (the “S&P 500 Index”) and the cumulative
return of the Standard & Poor’s MidCap 400 Index (the “S&P MidCap 400 Index”). We selected the S&P 500
Index because it is a broad index of the equity markets. We selected the S&P MidCap 400 Index, which is
comprised of issuers having a similar market capitalization with the Company, because we believe that there
are no other lines of business or published industry indices or peer groups that provide a more meaningful
comparison of the cumulative return of our stock. The graph assumes that $100 was invested on November
15, 2001 in each of (1) the Company’s common stock, (2) the S&P 500 Index and (3) the S&P MidCap 400
Index and that all dividends were reinvested.
11.15.01
100.00
100.00
100.00
12.28.01
113.22
100.88
105.17
12.28.07
158.06
143.70
190.39
01.02.09
103.60
90.53
121.41
12.31.09
106.77
114.49
166.79
12.31.10
140.58
131.74
211.23
12.30.11
208.62
134.52
207.54
12.29.06
180.76
136.21
176.32
12.30.05
167.56
117.63
159.83
12.31.04
139.22
112.13
142.00
01.02.04
132.14
101.12
121.90
12.27.02
153.73
78.58
89.89
Cumulative Total Return ($)
Company/Index
Weight Watchers International, Inc.
S&P 500 Index
S&P MidCap 400 Index
Weight Watchers International, Inc. S&P 500 Index S&P MidCap 400 Index
$0
$50
$100
$150
$200
$250
11.15.01 12.28.01 12.27.02 01.02.04 12.31.04 12.30.05 12.29.06 12.28.07 01.02.09 12.31.09 12.31.10 12.30.11