WeightWatchers 2011 Annual Report Download - page 59
Download and view the complete annual report
Please find page 59 of the 2011 WeightWatchers annual report below. You can navigate through the pages in the report by either clicking on the pages listed below, or by using the keyword search tool below to find specific information within the annual report.-
 1
1 -
2
-
3
-
4
-
5
-
6
-
7
-
8
-
9
-
10
-
11
-
12
-
13
-
14
-
15
-
16
-
17
-
18
-
19
-
20
-
21
-
22
-
23
-
24
-
25
-
26
-
27
-
28
-
29
-
30
-
31
-
32
-
33
-
34
-
35
-
36
-
37
-
38
-
39
-
40
-
41
-
42
-
43
-
44
-
45
-
46
-
47
-
48
-
 49
49 -
 50
50 -
 51
51 -
 52
52 -
 53
53 -
 54
54 -
 55
55 -
 56
56 -
 57
57 -
 58
58 -
 59
59 -
 60
60 -
 61
61 -
 62
62 -
 63
63 -
 64
64 -
 65
65 -
 66
66 -
 67
67 -
 68
68 -
 69
69 -
70
-
71
-
72
-
73
-
74
-
75
-
76
-
77
-
78
-
79
-
80
-
81
-
82
-
83
-
84
-
85
-
86
-
87
-
88
-
89
-
90
-
91
-
92
-
93
-
94
-
95
-
96
-
97
-
98
-
99
-
100
-
101
-
102
-
103
-
104
-
105
-
106
-
107
-
108
-
109
-
110
-
111
-
112
-
113
-
114
-
115
-
116
-
117
-
118
-
119
-
120
-
121
-
122
-
123
-
124
-
125
-
126
-
127
-
128
-
129
-
130
 |
 |
Share-Based Compensation
The fair value of restricted stock units and vested shares of restricted stock is determined by the market
price of our common stock on the date of grant. The fair value of option awards is estimated on the date of grant
using the Black-Scholes option pricing model, which requires estimates of the expected term of the option, the
expected volatility of the Company’s stock price, the risk-free interest rate and the expected dividend yield. We
recognize expense for all share-based awards based on the fair value of the number of awards we estimate will
fully vest. A change in these underlying assumptions will cause a change in the estimated fair value of share-
based awards and the underlying expense recorded. We continue to evaluate these estimates and assumptions and
believe that these assumptions are appropriate.
RESULTS OF OPERATIONS FOR FISCAL 2011 (52 weeks) COMPARED TO FISCAL 2010 (52 weeks)
OVERVIEW
Since the second quarter of fiscal 2010, the Company has experienced sustained growth in revenue,
volumes, and profitability in each quarter as compared to the prior year periods. The growth trend began with a
successful change in marketing strategy in both the meetings business and WeightWatchers.com in North
America in the second quarter of fiscal 2010, and accelerated throughout the remainder of fiscal 2010 fueled by
the soft launch of a new program platform in North America and the United Kingdom at the end of fiscal 2010.
Accordingly, by the end of fiscal 2010, our customer base had grown by more than 20% since the beginning of
fiscal 2010.
In January 2011, we began marketing campaigns for our new program launches which accelerated period-
over-period volume growth in the North American and UK meetings and WeightWatchers.com businesses to
historically high levels in the first quarter of fiscal 2011. As a result, on a consolidated Company basis, revenues
and volumes grew in all four quarters of fiscal 2011 as compared to the prior year periods. For the full year of
fiscal 2011, revenues increased 25.3% and paid weeks increased 38.1% versus the prior year. Our gross margin
for fiscal 2011 improved to 57.6%, up from 54.4% in fiscal 2010.
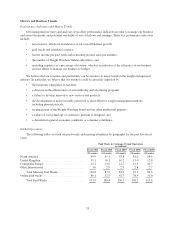
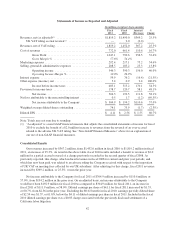
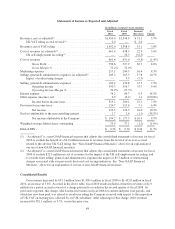
The table below shows our consolidated statements of income for fiscal 2011 versus fiscal 2010 on both a
reported basis and an adjusted basis. Results for fiscal 2010 are adjusted to exclude the $2.0 million benefit to
revenue of an over-accrual related to the previously disclosed adverse UK VAT tax ruling in the second quarter
of fiscal 2008. See “Non-GAAP Financial Measures” above.
41