WeightWatchers 2011 Annual Report Download - page 61
Download and view the complete annual report
Please find page 61 of the 2011 WeightWatchers annual report below. You can navigate through the pages in the report by either clicking on the pages listed below, or by using the keyword search tool below to find specific information within the annual report.-
 1
1 -
2
-
3
-
4
-
5
-
6
-
7
-
8
-
9
-
10
-
11
-
12
-
13
-
14
-
15
-
16
-
17
-
18
-
19
-
20
-
21
-
22
-
23
-
24
-
25
-
26
-
27
-
28
-
29
-
30
-
31
-
32
-
33
-
34
-
35
-
36
-
37
-
38
-
39
-
40
-
41
-
42
-
43
-
44
-
45
-
46
-
47
-
48
-
49
-
50
-
 51
51 -
 52
52 -
 53
53 -
 54
54 -
 55
55 -
 56
56 -
 57
57 -
 58
58 -
 59
59 -
 60
60 -
 61
61 -
 62
62 -
 63
63 -
 64
64 -
 65
65 -
 66
66 -
 67
67 -
 68
68 -
 69
69 -
 70
70 -
 71
71 -
72
-
73
-
74
-
75
-
76
-
77
-
78
-
79
-
80
-
81
-
82
-
83
-
84
-
85
-
86
-
87
-
88
-
89
-
90
-
91
-
92
-
93
-
94
-
95
-
96
-
97
-
98
-
99
-
100
-
101
-
102
-
103
-
104
-
105
-
106
-
107
-
108
-
109
-
110
-
111
-
112
-
113
-
114
-
115
-
116
-
117
-
118
-
119
-
120
-
121
-
122
-
123
-
124
-
125
-
126
-
127
-
128
-
129
-
130
 |
 |
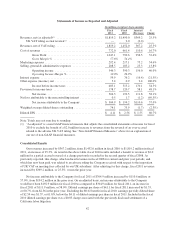
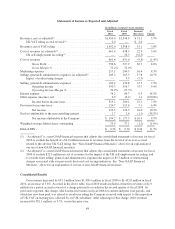
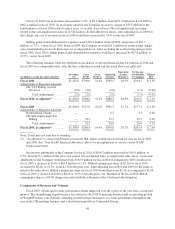
Revenues
Net revenues were $1,819.2 million in fiscal 2011, an increase of $367.2 million, or 25.3%, from $1,452.0
million in fiscal 2010. After excluding the $2.0 million adjustment to fiscal 2010 revenues for the UK VAT
reversal noted above, revenues increased by $369.2 million, or 25.5%, from the fiscal 2010 adjusted revenues of
$1,450.0 million. Excluding the impact of foreign currency, which increased our revenues in fiscal 2011 by $35.5
million, revenues grew 22.8% versus the prior year. Revenue growth in the period was driven by strong
momentum beginning at the start of fiscal 2011 from the new program launches at the end of fiscal 2010 in our
North American and UK meetings and WeightWatchers.com businesses, and further supported by effective
marketing and public relations activities in these markets in the period.
In fiscal 2011, global paid weeks grew 38.1%, global attendance grew 11.9% and end of period active
Online subscribers grew 50.5% in comparison to fiscal 2010, despite weak performance in our Continental
European meetings business. In the first quarter of fiscal 2011, when we launched our marketing campaigns for
the new programs in North America and the United Kingdom, strong enrollments and sign-ups of new and
former customers drove global paid weeks up 39.7%, global attendance up 20.3% and end of period active
Online subscribers up 86.6% versus the prior year period. Growth trends in meeting enrollments and Online
sign-ups moderated somewhat in both the second and third quarters of fiscal 2011 from the historically high
levels experienced in the first quarter of fiscal 2011, but remained strong despite lapping the one-year
anniversary of North America’s successful new marketing strategy launched in the second quarter of fiscal 2010.
In the fourth quarter of fiscal 2011, we continued to experience year-over-year growth versus the prior year
period, but at a slower pace then the first nine months as we lapped the one-year anniversary of the very
successful soft launch of the new program in our English-speaking markets.
Gross Profit and Operating Income
Gross profit in fiscal 2011 of $1,047.1 million increased $256.5 million, or 32.4%, from $790.6 million in
fiscal 2010. Operating income in fiscal 2011 was $546.3 million, an increase of $156.0 million, or 40.0%, from
$390.3 million in fiscal 2010. Our gross margin in fiscal 2011 increased by 310 basis points versus the prior year
to 57.6%, driving operating income margin expansion of 310 basis points versus the prior year to 30.0% in fiscal
2011. Margin expansion was primarily the result of operating leverage gained from higher attendances per
meeting and high growth in our higher margin WeightWatchers.com business. Operating income margin was
compressed slightly as a reduction in selling, general and administrative expenses as a percentage of revenues
was not enough to fully offset an increase in marketing as a percentage of revenues versus the prior year. It
should be noted that fiscal 2010 included $6.5 million of expense, included in both cost of revenues and selling,
general and administrative expense, associated with the previously disclosed settlement of a California litigation,
which lowered our operating income margin by 45 basis points in fiscal 2010.
Net Income and Earnings Per Share
The benefits derived from operating income growth, along with lower interest expense, resulted in net
income growth in fiscal 2011 of 57.0% versus the prior year to $304.9 million, up from $194.2 million in fiscal
2010. Earnings per fully diluted share in fiscal 2011 were $4.11, up $1.55 from $2.56 in fiscal 2010. The 2011
earnings per fully diluted share included a $0.05 tax benefit associated with the closing of our Finland business,
while the 2010 earnings per fully diluted share included a $0.02 revenue benefit from the UK VAT reversal and a
$0.05 charge associated with the previously disclosed settlement of a California litigation. In addition, foreign
currency provided a $0.10 benefit per fully diluted share in fiscal 2011.
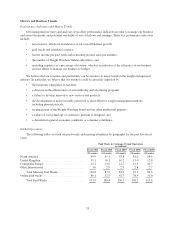
Components of Revenue and Volumes
We derive our revenues principally from meeting fees, products sold in meetings, Internet revenues, and
licensed products sold in retail channels. In addition, we generate other revenue from royalties paid to us by our
franchisees, subscriptions to our branded magazines, and advertising in our publications.
43