Tyson Foods 2003 Annual Report Download - page 66
Download and view the complete annual report
Please find page 66 of the 2003 Tyson Foods annual report below. You can navigate through the pages in the report by either clicking on the pages listed below, or by using the keyword search tool below to find specific information within the annual report.-
 1
1 -
2
-
3
-
4
-
5
-
6
-
7
-
8
-
9
-
10
-
11
-
12
-
13
-
14
-
15
-
16
-
17
-
18
-
19
-
20
-
21
-
22
-
23
-
24
-
25
-
26
-
27
-
28
-
29
-
30
-
31
-
32
-
33
-
34
-
35
-
36
-
37
-
38
-
39
-
40
-
41
-
42
-
43
-
44
-
45
-
46
-
47
-
48
-
49
-
50
-
51
-
52
-
53
-
54
-
55
-
 56
56 -
 57
57 -
 58
58 -
 59
59 -
 60
60 -
 61
61 -
 62
62 -
 63
63 -
 64
64 -
 65
65 -
 66
66 -
 67
67 -
 68
68 -
 69
69 -
 70
70 -
 71
71 -
 72
72
 |
 |

64 Tyson Foods, Inc.
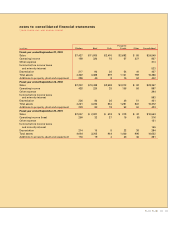
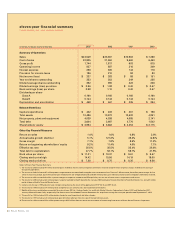
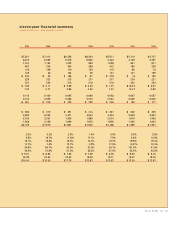
eleven-year financial summary
TYSON FOODS, INC. 2003 ANNUAL REPORT
in millions, except per share and ratio data 2003 2002 2001 2000
Summary of Operations
Sales $24,549 $ 23,367 $10,563 $ 7,268
Cost of sales 22,805 21,550 9,660 6,453
Gross profit 1,744 1,817 903 815
Operating income 837 887 316 349
Interest expense 296 305 144 116
Provision for income taxes 186 210 58 83
Net income (loss) $ 337 $ 383 $ 88 $ 151
Year end shares outstanding 353 353 349 225
Diluted average shares outstanding 352 355 222 226
Diluted earnings (loss) per share $ 0.96 $ 1.08 $ 0.40 $ 0.67
Basic earnings (loss) per share 0.98 1.10 0.40 0.67
Dividends per share
Class A 0.160 0.160 0.160 0.160
Class B 0.144 0.144 0.144 0.144
Depreciation and amortization $ 458 $ 467 $ 335 $ 294
Balance Sheet Data
Capital expenditures $ 402 $ 433 $ 261 $ 196
Total assets 10,486 10,372 10,632 4,841
Net property, plant and equipment 4,039 4,038 4,085 2,141
Total debt 3,604 3,987 4,776 1,542
Shareholders’ equity $ 3,954 $ 3,662 $ 3,354 $ 2,175
Other Key Financial Measures
Return on sales 1.4% 1.6% 0.8% 2.0%
Annual sales growth (decline) 5.1% 121.2% 45.3% (4.6)%
Gross margin 7.1% 7.8% 8.5% 11.2%
Return on beginning shareholders’ equity 9.2% 11.4% 4.0% 7.1%
Effective tax rate 35.5% 35.5% 35.4% 35.6%
Total debt to capitalization 47.7% 52.1% 58.7% 41.5%
Book value per share $ 11.21 $ 10.37 $ 9.61 $ 9.67
Closing stock price high 14.42 15.56 14.19 18.00
Closing stock price low $ 7.28 $ 8.75 $ 8.35 $ 8.56
Notes to Eleven-Year Financial Summary
1. The results for 2003 include $167 million of pretax gains related to vitamin antitrust litigation settlements received and $76 million of pretax charges related to the closing of
four poultry operations.
2. The results for 2002 include a $27 million pretax charge related to the identifiable intangible asset write-down of the Thomas E. Wilson brand, $26 million pretax charge for live
swine restructuring charge, $22 million pretax gain related to the sale of Specialty Brands and $30 million pretax gain related to vitamin antitrust litigation settlements received.
3. The results for 2001 include $26 million in pretax charges for expenses related to the IBP acquisition, loss on sale of swine assets, and product recall losses.
4. The results for 2000 include a $24 million pretax charge for bad debt writeoff related to the January 2000 bankruptcy filing of AmeriServe Food Distribution, Inc. and a $9 million
pretax charge related to Tyson de Mexico losses.
5. Certain costs for years 1999 and prior have not been reclassified as the result of the application of EITF 00-14 and EITF 00-25.
6. The results for 1999 include a $77 million pretax charge for loss on sale of assets and impairment write-downs.
7. Significant business combinations accounted for as purchases: IBP, inc., Hudson Foods, Inc. and Arctic Alaska Fisheries Corporation in August 2001 and September 2001,
January 1998 and October 1992, respectively. See Note 2 to the Consolidated Financial Statements for acquisitions during the three-year period ended September 27, 2003.
8. The results for 1998 include a $215 million pretax charge for asset impairment and other charges.
9. The results for 1997 include a $41 million pretax gain ($4 million after tax) from the sale of the beef division assets.
10.The results for 1994 include a $214 million pretax charge ($205 million after tax) due to the write-down of certain long-lived assets of Arctic Alaska Fisheries Corporation.