Tyson Foods 2003 Annual Report Download - page 57
Download and view the complete annual report
Please find page 57 of the 2003 Tyson Foods annual report below. You can navigate through the pages in the report by either clicking on the pages listed below, or by using the keyword search tool below to find specific information within the annual report.-
 1
1 -
2
-
3
-
4
-
5
-
6
-
7
-
8
-
9
-
10
-
11
-
12
-
13
-
14
-
15
-
16
-
17
-
18
-
19
-
20
-
21
-
22
-
23
-
24
-
25
-
26
-
27
-
28
-
29
-
30
-
31
-
32
-
33
-
34
-
35
-
36
-
37
-
38
-
39
-
40
-
41
-
42
-
43
-
44
-
45
-
46
-
 47
47 -
 48
48 -
 49
49 -
 50
50 -
 51
51 -
 52
52 -
 53
53 -
 54
54 -
 55
55 -
 56
56 -
 57
57 -
 58
58 -
 59
59 -
 60
60 -
 61
61 -
 62
62 -
 63
63 -
 64
64 -
 65
65 -
 66
66 -
 67
67 -
68
-
69
-
70
-
71
-
72
 |
 |

Tyson Foods, Inc. 55
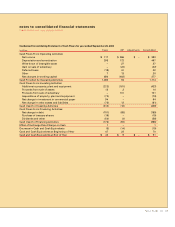
notes to consolidated financial statements
TYSON FOODS, INC. 2003 ANNUAL REPORT
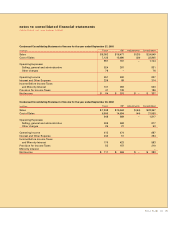
Prepared
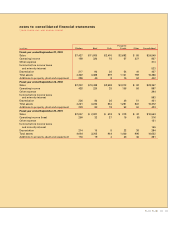
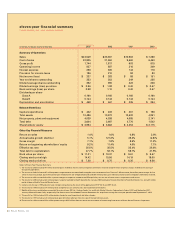
in millions Chicken Beef Pork Foods Other Consolidated
Fiscal year ended September 27, 2003
Sales $7,427 $11,935 $2,470 $ 2,662 $ 55 $24,549
Operating income 158 320 75 57 227 837
Other expense 314
Income before income taxes
and minority interest 523
Depreciation 217 90 26 54 40 427
Total assets 4,322 3,385 879 1,141 759 10,486
Additions to property, plant and equipment 286 40 9 15 52 402
Fiscal year ended September 28, 2002
Sales $7,222 $10,488 $2,503 $ 3,072 $ 82 $23,367
Operating income 428 220 25 158 56 887
Other expense 294
Income before income taxes
and minority interest 593
Depreciation 226 80 26 48 51 431
Total assets 4,221 3,234 834 1,261 822 10,372
Additions to property, plant and equipment 229 82 19 53 50 433
Fiscal year ended September 29, 2001
Sales $7,057 $ 2,027 $ 619 $ 818 $ 42 $10,563
Operating income (loss) 250 32 27 15 (8) 316
Other expense 151
Income before income taxes
and minority interest 165
Depreciation 214 15 5 22 38 294
Total assets 4,084 3,203 944 1,406 995 10,632
Additions to property, plant and equipment 176 19 4 26 36 261