Tyson Foods 2003 Annual Report Download - page 49
Download and view the complete annual report
Please find page 49 of the 2003 Tyson Foods annual report below. You can navigate through the pages in the report by either clicking on the pages listed below, or by using the keyword search tool below to find specific information within the annual report.-
 1
1 -
2
-
3
-
4
-
5
-
6
-
7
-
8
-
9
-
10
-
11
-
12
-
13
-
14
-
15
-
16
-
17
-
18
-
19
-
20
-
21
-
22
-
23
-
24
-
25
-
26
-
27
-
28
-
29
-
30
-
31
-
32
-
33
-
34
-
35
-
36
-
37
-
38
-
 39
39 -
 40
40 -
 41
41 -
 42
42 -
 43
43 -
 44
44 -
 45
45 -
 46
46 -
 47
47 -
 48
48 -
 49
49 -
 50
50 -
 51
51 -
 52
52 -
 53
53 -
 54
54 -
 55
55 -
 56
56 -
 57
57 -
 58
58 -
 59
59 -
60
-
61
-
62
-
63
-
64
-
65
-
66
-
67
-
68
-
69
-
70
-
71
-
72
 |
 |

Tyson Foods, Inc. 47
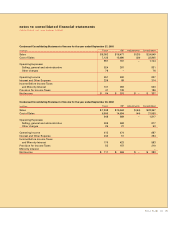
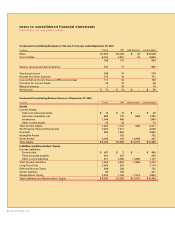
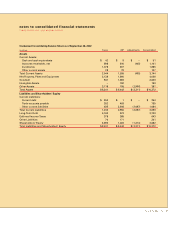
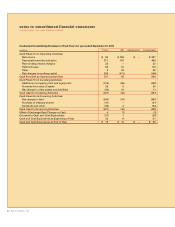
notes to consolidated financial statements
TYSON FOODS, INC. 2003 ANNUAL REPORT
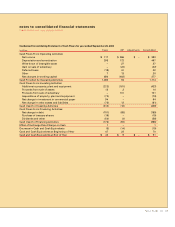
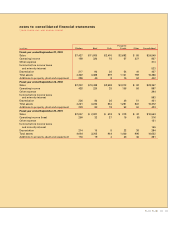
Condensed Consolidating Balance Sheet as of September 28, 2002
in millions Tyson IBP Adjustments Consolidated
Assets
Current Assets:
Cash and cash equivalents $ 42 $ 9 $ – $ 51
Accounts receivable, net 896 610 (405) 1,101
Inventories 1,078 807 1,885
Other current assets 28 79 107
Total Current Assets 2,044 1,505 (405) 3,144
Net Property, Plant and Equipment 2,138 1,900 4,038
Goodwill 941 1,692 2,633
Intangible Assets – 190 190
Other Assets 3,118 155 (2,906) 367
Total Assets $ 8,241 $ 5,442 $ (3,311) $10,372
Liabilities and Shareholders’ Equity
Current Liabilities:
Current debt $ 253 $ 1 $ – $ 254
Trade accounts payable 352 403 755
Other current liabilities 635 2,546 (2,097) 1,084
Total Current Liabilities 1,240 2,950 (2,097) 2,093
Long-Term Debt 3,160 573 3,733
Deferred Income Taxes 378 265 643
Other Liabilities 70 171 241
Shareholders’ Equity 3,393 1,483 (1,214) 3,662
Total Liabilities and Shareholders’ Equity $ 8,241 $ 5,442 $ (3,311) $10,372