Tyson Foods 2003 Annual Report Download - page 27
Download and view the complete annual report
Please find page 27 of the 2003 Tyson Foods annual report below. You can navigate through the pages in the report by either clicking on the pages listed below, or by using the keyword search tool below to find specific information within the annual report.-
 1
1 -
2
-
3
-
4
-
5
-
6
-
7
-
8
-
9
-
10
-
11
-
12
-
13
-
14
-
15
-
16
-
 17
17 -
 18
18 -
 19
19 -
 20
20 -
 21
21 -
 22
22 -
 23
23 -
 24
24 -
 25
25 -
 26
26 -
 27
27 -
 28
28 -
 29
29 -
 30
30 -
 31
31 -
 32
32 -
 33
33 -
 34
34 -
 35
35 -
 36
36 -
 37
37 -
38
-
39
-
40
-
41
-
42
-
43
-
44
-
45
-
46
-
47
-
48
-
49
-
50
-
51
-
52
-
53
-
54
-
55
-
56
-
57
-
58
-
59
-
60
-
61
-
62
-
63
-
64
-
65
-
66
-
67
-
68
-
69
-
70
-
71
-
72
 |
 |

Tyson Foods, Inc. 25
management’s discussion and analysis
TYSON FOODS, INC. 2003 ANNUAL REPORT
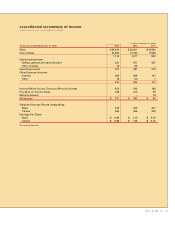
Cost of sales increased $12 billion or 123.1%, primarily
due to the inclusion of IBP’s cost of sales in fiscal 2002.
As a percent of sales, cost of sales was 92.2% for 2002
compared to 91.5% for 2001.
Selling, general and administrative expenses increased
$290 million or 49.5%, primarily due to the inclusion of
IBP’s operations in fiscal 2002. As a percent of sales,
operating expenses were 3.8% for 2002 compared to
5.6% in 2001. In its effort to integrate, restructure and
reorganize, the Company improved efficiencies and
lowered plant operating costs. These costs were also
reduced through other cost-containment efforts and
improved sales expense management.
Other charges include $27 million related to the discon-
tinuation of the Thomas E. Wilson brand and $26 million
related to the restructuring of the Company’s live swine
operation.
Interest expense increased 111.8% compared to 2001. As
a percent of sales, interest expense was 1.3% compared
to 1.4% for 2001. The Company’s average indebtedness
increased by 109.7% over fiscal 2001 due to debt incurred
to purchase IBP. The Company’s short-term interest rates
decreased to 3.3% in fiscal 2002 as compared to 5.1% in
fiscal 2001. The overall weighted average borrowing rate
on total debt was 7.0% for fiscal 2002 compared to 6.9%
for fiscal 2001.
Other income increased in the current year due to a gain
of $22 million from the sale of the Specialty Brands, Inc.
subsidiary.
The effective tax rate was 35.5% in 2002 compared to
35.4% in 2001. The Company adopted Statement of
Financial Accounting Standards No. 142, “Goodwill and
Other Intangible Assets” (SFAS No. 142), at the beginning
of 2002. Under SFAS No. 142 the Company no longer
amortized goodwill which resulted in a decrease in the
effective tax rate for 2002, offset primarily by a reduction
in the foreign sales benefit.
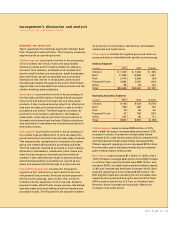
SEGMENT INFORMATION
For the periods ending September 28, 2002, and
September 29, 2001, the following information includes
100% of IBP results for 52 weeks and nine weeks, respec-
tively. Information on segments is as follows:
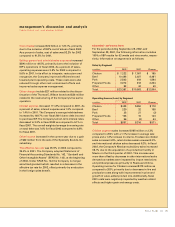
Sales by Segment
in millions 2002 2001 Change
Chicken $ 7,222 $ 7,057 $ 165
Beef 10,488 2,027 8,461
Pork 2,503 619 1,884
Prepared Foods 3,072 818 2,254
Other 82 42 40
Total $23,367 $10,563 $12,804
Operating Income (Loss) by Segment
in millions 2002 2001 Change
Chicken $ 428 $ 250 $ 178
Beef 220 32 188
Pork 25 27 (2)
Prepared Foods 158 15 143
Other 56 (8) 64
Total $ 887 $ 316 $ 571
Chicken segment sales increased $165 million or 2.3%
compared to 2001, with a 1.1% increase in average sale
prices and a 1.2% increase in volume. Foodservice chicken
sales increased 4.9%, retail chicken sales increased 2.0%
and international chicken sales decreased 6.3%. In fiscal
2002, the Company’s Mexican subsidiary sales increased
36.1% due to the acquisition of a production facility in
Mexico in the third quarter of 2001. This increase was
more than offset by decreases in other international sales
demand as markets were impacted by import restrictions
and political pressures primarily in Russia and China.
Operating income for Chicken increased $178 million as
compared to 2001, primarily due to decreases in live and
production costs along with improvements in price and
growth in value-added product mix. Additionally, fiscal
2001 costs were negatively impacted by weather related
effects and higher grain and energy costs.