Tyson Foods 2003 Annual Report Download - page 26
Download and view the complete annual report
Please find page 26 of the 2003 Tyson Foods annual report below. You can navigate through the pages in the report by either clicking on the pages listed below, or by using the keyword search tool below to find specific information within the annual report.-
 1
1 -
2
-
3
-
4
-
5
-
6
-
7
-
8
-
9
-
10
-
11
-
12
-
13
-
14
-
15
-
 16
16 -
 17
17 -
 18
18 -
 19
19 -
 20
20 -
 21
21 -
 22
22 -
 23
23 -
 24
24 -
 25
25 -
 26
26 -
 27
27 -
 28
28 -
 29
29 -
 30
30 -
 31
31 -
 32
32 -
 33
33 -
 34
34 -
 35
35 -
 36
36 -
37
-
38
-
39
-
40
-
41
-
42
-
43
-
44
-
45
-
46
-
47
-
48
-
49
-
50
-
51
-
52
-
53
-
54
-
55
-
56
-
57
-
58
-
59
-
60
-
61
-
62
-
63
-
64
-
65
-
66
-
67
-
68
-
69
-
70
-
71
-
72
 |
 |

24 Tyson Foods, Inc.
management’s discussion and analysis
TYSON FOODS, INC. 2003 ANNUAL REPORT
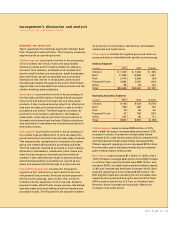
Pork segment sales decreased $33 million or 1.3%, with
a 2.9% increase in average sales prices and a 4.1%
decrease in volume. Case-ready pork sales were $221 mil-
lion and increased 52.3%, domestic fresh meat pork sales
decreased 3.5%, international pork sales increased 2.8%
and live swine sales decreased 42.6%. Pork segment
operating income increased $50 million. Excluding the
fourth quarter 2002 live swine restructuring charge
of $26 million, operating income increased $24 million.
The decline in sales is primarily due to a reduction in live
swine sales as a result of the prior year live swine restruc-
turing and lower average selling prices for our finished
product. Operating income was positively affected by
the prior year restructuring of the live swine operation,
partially offset by higher live hog prices.
Prepared Foods segment sales decreased $410 million
or 13.4%, with a 5.9% decrease in average sales prices
and an 8.0% decrease in volume. Excluding prior year
Specialty Brands sales of $244 million, segment sales
declined $166 million and volume declined slightly.
Segment operating income decreased $101 million from
the same period last year. Excluding the prior year
Thomas E. Wilson brand write-down of $27 million,
operating income declined $128 million. This decline
results primarily from the increases during the year in
raw material prices, lower average selling prices,
increased costs related to the introduction of more than
75 new products this year and temporary operating
inefficiencies at certain plants.
Other segment operating income increased $171 million
primarily due to settlements received in connection with
the vitamin antitrust litigation. Current year results
include $167 million as compared to $30 million received
in fiscal 2002. Additionally, operating income was posi-
tively affected by actuarial gains of $13 million resulting
from changes to certain retiree medical benefit plans.
2002 vs. 2001
On August 3, 2001, the Company acquired 50.1% own-
ership of IBP and acquired the remaining 49.9% on
September 28, 2001. Accordingly, fiscal 2002 earnings
include 52 weeks of IBP’s results of operations, while fiscal
2001 fourth quarter and 12 months results include 50.1%
of IBP’s results for the nine weeks ended September 29,
2001. This information should be considered when
comparing to fiscal 2001 results of operations.
Certain reclassifications have been made to prior periods
to conform to current presentations.
In accordance with the provisions issued in Financial
Accounting Standards Board No. 142, “Goodwill and
Other Intangible Assets,” which the Company adopted at
the beginning of fiscal 2002, goodwill and indefinite lived
assets are no longer amortized. The effect on fiscal year
2001 results would have been an increase of approxi-
mately $0.14 cents per diluted share.
In accordance with the guidance provided in Emerging
Issues Task Force (EITF) Issue No. 00-14, “Accounting
for Certain Sales Incentives,” and EITF Issue No. 00-25,
“Vendor Income Statement Characterization of
Consideration Paid to a Reseller of the Vendor’s Products,”
beginning in the first quarter of fiscal 2002, the Company
classifies the costs associated with sales incentives pro-
vided to retailers and payments such as slotting fees and
cooperative advertising to vendors as a reduction in
sales. These costs were previously included in selling,
general and administrative expense. These reclassifica-
tions resulted in a reduction to sales and selling, general
and administrative expense of approximately $188 mil-
lion for fiscal year 2001, and had no impact on reported
income before income taxes and minority interest, net
income or earnings per share amounts.
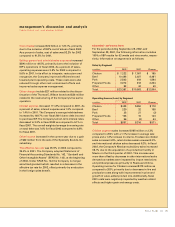
Sales increased $13 billion or 121.2%, with a 98.9%
increase in volume and an 11.2% increase in price. The
increase in sales volume and price is primarily due to the
inclusion of IBP’s sales in fiscal 2002. Despite lower com-
modity prices, sales prices increased due to product mix
changes as the Company’s value-added businesses grew.