Tyson Foods 2003 Annual Report Download - page 35
Download and view the complete annual report
Please find page 35 of the 2003 Tyson Foods annual report below. You can navigate through the pages in the report by either clicking on the pages listed below, or by using the keyword search tool below to find specific information within the annual report.-
 1
1 -
2
-
3
-
4
-
5
-
6
-
7
-
8
-
9
-
10
-
11
-
12
-
13
-
14
-
15
-
16
-
17
-
18
-
19
-
20
-
21
-
22
-
23
-
24
-
 25
25 -
 26
26 -
 27
27 -
 28
28 -
 29
29 -
 30
30 -
 31
31 -
 32
32 -
 33
33 -
 34
34 -
 35
35 -
 36
36 -
 37
37 -
 38
38 -
 39
39 -
 40
40 -
 41
41 -
 42
42 -
 43
43 -
 44
44 -
 45
45 -
46
-
47
-
48
-
49
-
50
-
51
-
52
-
53
-
54
-
55
-
56
-
57
-
58
-
59
-
60
-
61
-
62
-
63
-
64
-
65
-
66
-
67
-
68
-
69
-
70
-
71
-
72
 |
 |

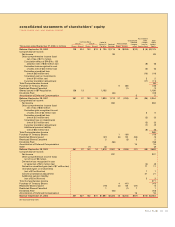
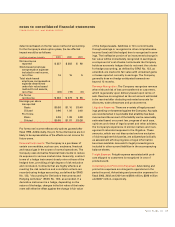
Tyson Foods, Inc. 33
consolidated statements of shareholders’ equity
TYSON FOODS, INC. 2003 ANNUAL REPORT
Accumulated
Unamortized Other Total
Common Stock Capital In Deferred Compre- Share-
Class A Class B Excess Of Retained Treasury Stock Compen- hensive holders’
Three years ended September 27, 2003, in millions
Shares Amount Shares Amount Par Value Earnings Shares Amount sation Income (Loss) Equity
Balance–September 30, 2000 138 $14 103 $10 $ 735 $1,715 16 $(284) $(10) $ (5) $2,175
Comprehensive Income:
Net income 88 88
Other comprehensive income (loss)
net of tax of $(11) million
Cumulative effect of SFAS No. 133
adoption (net of $(3) million tax) (6) (6)
Derivative loss recognized in cost
of sales (net of $(3) million tax) (5) (5)
Derivative unrealized loss
(net of $(6) million tax) (10) (10)
Unrealized gain on investments
(net of $1 million tax) 22
Currency translation adjustment (11) (11)
Total Comprehensive Income 58
Purchase of Treasury Shares 5 (48) (48)
Restricted Shares Cancelled (1) (1)
Shares Issued in IBP Acquisition 129 13 1,185 1,198
Dividends Paid (33) (33)
Amortization of Deferred Compensation 55
Balance–September 29, 2001 267 27 103 10 1,920 1,770 21 (333) (5) (35) 3,354
Comprehensive Income:
Net income 383 383
Other comprehensive income (loss)
net of tax of $(5) million
Derivative gain recognized in cost
of sales (net of $2 million tax) 55
Derivative unrealized loss
(net of $(1) million tax) (2) (2)
Unrealized loss on investments
(net of $(1) million tax) (2) (2)
Currency translation adjustment (7) (7)
Additional pension liability
(net of $(5) million tax) (8) (8)
Total Comprehensive Income 369
Purchase of Treasury Shares 1 (19) (19)
Restricted Shares Issued (41) (6) 90 (50) (1)
Restricted Shares Cancelled 2 (3) 3 2
Dividends Paid (56) (56)
Amortization of Deferred Compensation 15 15
Other (1) (2) (2)
Balance–September 28, 2002 267 27 102 10 1,879 2,097 16 (265) (37) (49) 3,662
Comprehensive Income:
Net income 337 337
Other comprehensive income (loss)
net of tax of $8 million
Derivative loss recognized in cost
of sales (net of $(1) million tax) (2) (2)
Derivative unrealized gain (net of $7 million tax) 11 11
Unrealized gain on investments
(net of $1 million tax) 11
Currency translation adjustment 21 21
Additional pension liability
(net of $2 million tax) 33
Total Comprehensive Income 371
Purchase of Treasury Shares 4 (41) (41)
Restricted Shares Issued (19) (4) 55 (37) (1)
Restricted Shares Cancelled 1 (1) 1 1
Dividends Paid (54) (54)
Amortization of Deferred Compensation 16 16
Balance–September 27, 2003 267 $27 102 $10 $1,861 $2,380 16 $(252) $(57) $(15) $3,954
See accompanying notes.