Tyson Foods 2003 Annual Report Download - page 33
Download and view the complete annual report
Please find page 33 of the 2003 Tyson Foods annual report below. You can navigate through the pages in the report by either clicking on the pages listed below, or by using the keyword search tool below to find specific information within the annual report.-
 1
1 -
2
-
3
-
4
-
5
-
6
-
7
-
8
-
9
-
10
-
11
-
12
-
13
-
14
-
15
-
16
-
17
-
18
-
19
-
20
-
21
-
22
-
 23
23 -
 24
24 -
 25
25 -
 26
26 -
 27
27 -
 28
28 -
 29
29 -
 30
30 -
 31
31 -
 32
32 -
 33
33 -
 34
34 -
 35
35 -
 36
36 -
 37
37 -
 38
38 -
 39
39 -
 40
40 -
 41
41 -
 42
42 -
 43
43 -
44
-
45
-
46
-
47
-
48
-
49
-
50
-
51
-
52
-
53
-
54
-
55
-
56
-
57
-
58
-
59
-
60
-
61
-
62
-
63
-
64
-
65
-
66
-
67
-
68
-
69
-
70
-
71
-
72
 |
 |

Tyson Foods, Inc. 31
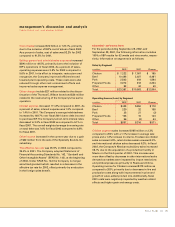
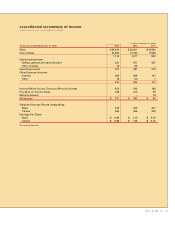
consolidated statements of income
TYSON FOODS, INC. 2003 ANNUAL REPORT
in millions, except per share data
Three years ended September 27, 2003 2003 2002 2001
Sales $ 24,549 $ 23,367 $ 10,563
Cost of Sales 22,805 21,550 9,660
1,744 1,817 903
Operating Expenses:
Selling, general and administrative 831 877 587
Other charges 76 53 –
Operating Income 837 887 316
Other Expense (Income):
Interest 296 305 144
Other 18 (11) 7
314 294 151
Income Before Income Taxes and Minority Interest 523 593 165
Provision for Income Taxes 186 210 58
Minority Interest ––19
Net Income $ 337 $ 383 $ 88
Weighted Average Shares Outstanding:
Basic 346 348 221
Diluted 352 355 222
Earnings Per Share:
Basic $ 0.98 $ 1.10 $ 0.40
Diluted $ 0.96 $ 1.08 $ 0.40
See accompanying notes.