Tyson Foods 2003 Annual Report Download - page 28
Download and view the complete annual report
Please find page 28 of the 2003 Tyson Foods annual report below. You can navigate through the pages in the report by either clicking on the pages listed below, or by using the keyword search tool below to find specific information within the annual report.-
 1
1 -
2
-
3
-
4
-
5
-
6
-
7
-
8
-
9
-
10
-
11
-
12
-
13
-
14
-
15
-
16
-
17
-
 18
18 -
 19
19 -
 20
20 -
 21
21 -
 22
22 -
 23
23 -
 24
24 -
 25
25 -
 26
26 -
 27
27 -
 28
28 -
 29
29 -
 30
30 -
 31
31 -
 32
32 -
 33
33 -
 34
34 -
 35
35 -
 36
36 -
 37
37 -
 38
38 -
39
-
40
-
41
-
42
-
43
-
44
-
45
-
46
-
47
-
48
-
49
-
50
-
51
-
52
-
53
-
54
-
55
-
56
-
57
-
58
-
59
-
60
-
61
-
62
-
63
-
64
-
65
-
66
-
67
-
68
-
69
-
70
-
71
-
72
 |
 |

26 Tyson Foods, Inc.
management’s discussion and analysis
TYSON FOODS, INC. 2003 ANNUAL REPORT
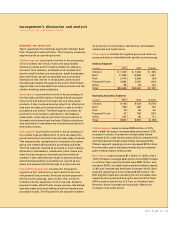
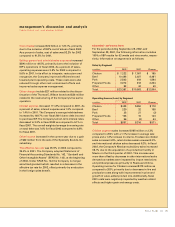
Beef segment sales were $10.5 billion, including beef
case-ready sales of $795 million and international beef
sales of $1.4 billion. Beef segment operating income
totaled $220 million. The Beef segment resulted from the
acquisition of IBP in the fourth quarter of fiscal 2001.
Pork segment sales including IBP’s pork processing
revenues were $2.5 billion compared to $619 million in
2001, including fiscal 2002 pork case-ready sales of
$145 million and international pork sales of $248 million.
Pork segment operating income decreased $2 million
from 2001. Sales and operating income were positively
affected by the inclusion of the IBP pork processing
results in fiscal 2002. However, both were impacted
by the negative results of the live swine operation.
Operating income was also affected by the restructuring
charge related to the Company’s live swine operation
of approximately $26 million in the fourth quarter of
fiscal 2002.
Prepared Foods segment sales increased $2.3 billion
compared to 2001. The Prepared Foods segment operat-
ing income increased $143 million. The increase in both
sales and operating income is primarily due to the
inclusion of IBP results. Operating income was also
influenced by lower and more stable raw material prices
and improvement in product mix. These increases were
partially offset by the Thomas E. Wilson write-down of
$27 million related to the discontinuation of the brand.
Other segment operating income increased $64 million
primarily due to the partial settlement of approximately
$30 million received in the third quarter of fiscal 2002
related to vitamin antitrust litigation combined with prior
year IBP merger related expenses of $19 million.
ACQUISITIONS
In August 2001, the Company acquired 50.1% of IBP by
paying approximately $1.7 billion in cash. In September
2001, the Company issued approximately 129 million
shares of Class A stock, with a fair value of approximately
$1.2 billion, to acquire the remaining IBP shares, and
assumed approximately $1.7 billion of IBP debt. The total
acquisition cost of approximately $4.6 billion was
accounted for as a purchase in accordance with SFAS
No. 141, “Business Combinations.” Accordingly, the
tangible and identifiable intangible assets and liabilities
have been adjusted to fair values with the remainder of
the purchase price recorded as goodwill. The allocation
of the purchase price has been completed.
In May 2002, the Company acquired the assets of Millard
Processing Services, a bacon processing operation, for
approximately $73 million in cash. The acquisition has
been accounted for as a purchase, and goodwill of
approximately $14 million has been recorded.
DISPOSITION
In September 2002, the Company completed the sale of
its Specialty Brands, Inc. subsidiary. The subsidiary had
been acquired with the IBP acquisition and its results of
operations were included in the Company’s Prepared
Foods segment. The Company received cash proceeds of
approximately $131 million, which were used to reduce
indebtedness, and recognized a pretax gain of $22 million.
Specialty Brands, Inc.’s sales and operating income for the
year ended September 28, 2002, were $244 million and
$2 million, respectively.
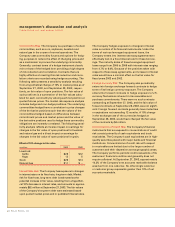
LIQUIDITY AND CAPITAL RESOURCES
Cash provided by operations continues to be the
Company’s primary source of funds to finance operating
requirements and capital expenditures. In 2003, net cash
of $820 million was provided by operating activities,
down $354 million from 2002. The decrease from fiscal
2002 is primarily due to a net change in working capital of
$423 million and a decrease in net income of $46 million,
partially offset by an increase in deferred taxes of $91 mil-
lion. The change in working capital is primarily due to
increased accounts receivable resulting from increased
sales and increased inventory values, as well as the
timing of cash receipts and payments related to other
working capital items. The Company’s foreseeable cash
needs for operations and capital expenditures are
expected to continue to be met through cash flows pro-
vided by operating activities. Additionally, at September 27,
2003, the Company had borrowing capacity of $1.5 billion
consisting of $705 million available under its $1 billion
unsecured revolving credit facilities and $750 million
under its accounts receivable securitization. At September
27, 2003, the Company had construction projects in