Tyson Foods 2003 Annual Report Download - page 54
Download and view the complete annual report
Please find page 54 of the 2003 Tyson Foods annual report below. You can navigate through the pages in the report by either clicking on the pages listed below, or by using the keyword search tool below to find specific information within the annual report.-
 1
1 -
2
-
3
-
4
-
5
-
6
-
7
-
8
-
9
-
10
-
11
-
12
-
13
-
14
-
15
-
16
-
17
-
18
-
19
-
20
-
21
-
22
-
23
-
24
-
25
-
26
-
27
-
28
-
29
-
30
-
31
-
32
-
33
-
34
-
35
-
36
-
37
-
38
-
39
-
40
-
41
-
42
-
43
-
 44
44 -
 45
45 -
 46
46 -
 47
47 -
 48
48 -
 49
49 -
 50
50 -
 51
51 -
 52
52 -
 53
53 -
 54
54 -
 55
55 -
 56
56 -
 57
57 -
 58
58 -
 59
59 -
 60
60 -
 61
61 -
 62
62 -
 63
63 -
 64
64 -
65
-
66
-
67
-
68
-
69
-
70
-
71
-
72
 |
 |
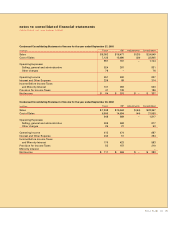
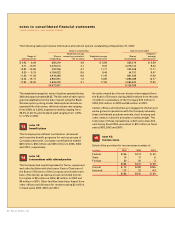
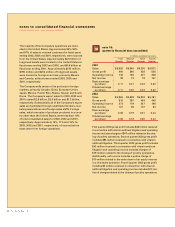
The following table summarizes information about stock options outstanding at September 27, 2003:
Options outstanding Options exercisable
Weighted average Weighted
Range of Shares remaining contractual Weighted average Shares average
exercise prices outstanding life (in years) exercise price excercisable exercise price
$ 4.93 – 6.69 665,219 4.9 $ 5.59 665,219 $ 5.59
6.71 – 10.91 3,275,013 4.1 9.32 3,275,013 9.32
10.92 – 13.85 232,206 4.7 11.71 232,206 11.71
9.30 – 9.75 4,194,022 8.5 9.49 44,731 9.47
11.23 – 11.63 4,919,286 9.6 11.45 961,548 11.50
13.33 – 15.17 4,950,981 7.3 13.89 1,893,069 14.77
17.92 – 18.00 2,636,200 3.1 17.92 2,063,520 17.92
20,872,927 9,135,306
52 Tyson Foods, Inc.
notes to consolidated financial statements
TYSON FOODS, INC. 2003 ANNUAL REPORT
The weighted average fair value of options granted during
2003 was approximately $4.32. The fair value of each option
grant is established on the date of grant using the Black-
Scholes option-pricing model. Assumptions include an
expected life of six years, risk-free interest rate ranging
from 2.56% to 3.30%, expected volatility ranging from
38.2% to 40.1% and dividend yield ranging from 1.20%
to 1.72% in 2003.
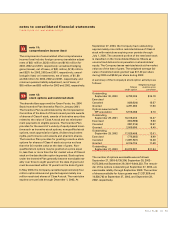
note 13:
benefit plans
The Company has defined contribution retirement
and incentive benefit programs for various groups of
Company personnel. Company contributions totaled
$48 million, $50 million and $35 million in 2003, 2002
and 2001, respectively.
note 14:
transactions with related parties
The Company has operating leases for farms, equipment
and other facilities with the former Senior Chairman of
the Board of Directors of the Company and certain mem-
bers of his family, as well as a trust controlled by him,
for rentals of $8 million in 2003, $9 million in 2002 and
$9 million in 2001. Other facilities have been leased from
other officers and directors for rentals totaling $2 million
in fiscal years 2003, 2002 and 2001.
14
13
An entity owned by a former director that resigned from
the Board of Directors during 2003 received from the sale
of cattle to a subsidiary of the Company $10 million in
2003, $10 million in 2002 and $5 million in 2001.
Certain officers and directors are engaged in chicken and
swine growout operations with the Company whereby
these individuals purchase animals, feed, housing and
other items to raise the animals to market weight. The
total value of these transactions, which were discontin-
ued during fiscal 2003, amounted to $10 million in fiscal
years 2003, 2002 and 2001.
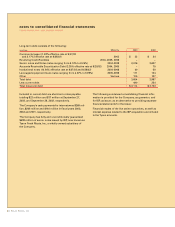
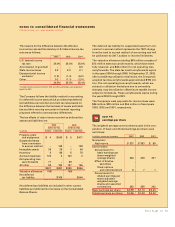
note 15:
income taxes
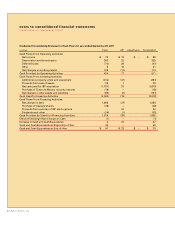
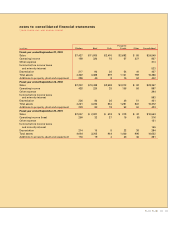
Detail of the provision for income taxes consists of:
in millions 2003 2002 2001
Federal $156 $173 $ 50
State 10 17 5
Foreign 20 20 3
$186 $210 $ 58
Current $ 73 $188 $105
Deferred 113 22 (47)
$186 $210 $ 58
15