Tyson Foods 2003 Annual Report Download - page 50
Download and view the complete annual report
Please find page 50 of the 2003 Tyson Foods annual report below. You can navigate through the pages in the report by either clicking on the pages listed below, or by using the keyword search tool below to find specific information within the annual report.-
 1
1 -
2
-
3
-
4
-
5
-
6
-
7
-
8
-
9
-
10
-
11
-
12
-
13
-
14
-
15
-
16
-
17
-
18
-
19
-
20
-
21
-
22
-
23
-
24
-
25
-
26
-
27
-
28
-
29
-
30
-
31
-
32
-
33
-
34
-
35
-
36
-
37
-
38
-
39
-
 40
40 -
 41
41 -
 42
42 -
 43
43 -
 44
44 -
 45
45 -
 46
46 -
 47
47 -
 48
48 -
 49
49 -
 50
50 -
 51
51 -
 52
52 -
 53
53 -
 54
54 -
 55
55 -
 56
56 -
 57
57 -
 58
58 -
 59
59 -
 60
60 -
61
-
62
-
63
-
64
-
65
-
66
-
67
-
68
-
69
-
70
-
71
-
72
 |
 |

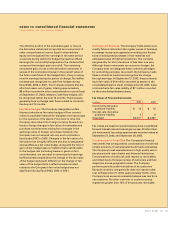
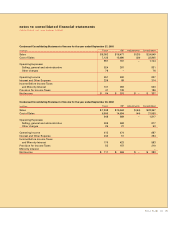
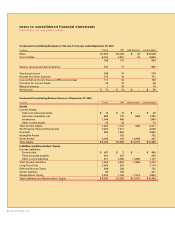
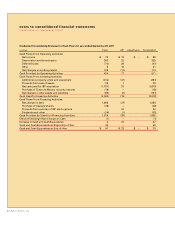
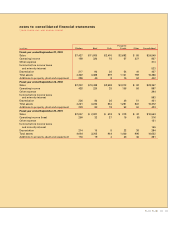
Condensed Consolidating Statement of Cash Flows for year ended September 27, 2003
in millions Tyson IBP Adjustments Consolidated
Cash Flows From Operating Activities:
Net income $ 84 $ 253 $ – $ 337
Depreciation and amortization 271 187 458
Plant closing related charges 22 – 22
Deferred taxes 82 31 113
Other 3 33 36
Net changes in working capital 265 (411) (146)
Cash Provided by Operating Activities 727 93 820
Cash Flows From Investing Activities:
Additions to property, plant and equipment (316) (86) (402)
Proceeds from sale of assets 25 5 30
Net change in other assets and liabilities (30) 41 11
Cash Used for Investing Activities (321) (40) (361)
Cash Flows From Financing Activities:
Net change in debt (340) (47) (387)
Purchase of treasury shares (41) – (41)
Dividends and other (56) 2 (54)
Cash Used for Financing Activities (437) (45) (482)
Effect of Exchange Rate Change on Cash 4 (7) (3)
Decrease in Cash and Cash Equivalents (27) 1 (26)
Cash and Cash Equivalents at Beginning of Year 42 9 51
Cash and Cash Equivalents at End of Year $ 15 $ 10 $ – $ 25
48 Tyson Foods, Inc.
notes to consolidated financial statements
TYSON FOODS, INC. 2003 ANNUAL REPORT