Tyson Foods 2003 Annual Report Download - page 25
Download and view the complete annual report
Please find page 25 of the 2003 Tyson Foods annual report below. You can navigate through the pages in the report by either clicking on the pages listed below, or by using the keyword search tool below to find specific information within the annual report.-
 1
1 -
2
-
3
-
4
-
5
-
6
-
7
-
8
-
9
-
10
-
11
-
12
-
13
-
14
-
 15
15 -
 16
16 -
 17
17 -
 18
18 -
 19
19 -
 20
20 -
 21
21 -
 22
22 -
 23
23 -
 24
24 -
 25
25 -
 26
26 -
 27
27 -
 28
28 -
 29
29 -
 30
30 -
 31
31 -
 32
32 -
 33
33 -
 34
34 -
 35
35 -
36
-
37
-
38
-
39
-
40
-
41
-
42
-
43
-
44
-
45
-
46
-
47
-
48
-
49
-
50
-
51
-
52
-
53
-
54
-
55
-
56
-
57
-
58
-
59
-
60
-
61
-
62
-
63
-
64
-
65
-
66
-
67
-
68
-
69
-
70
-
71
-
72
 |
 |

Tyson Foods, Inc. 23
management’s discussion and analysis
TYSON FOODS, INC. 2003 ANNUAL REPORT
SEGMENT INFORMATION
Tyson operates in five business segments: Chicken, Beef,
Pork, Prepared Foods and Other. The Company measures
segment profit as operating income.
Chicken segment is primarily involved in the processing
of live chickens into fresh, frozen and value-added
chicken products sold through domestic foodservice,
domestic food retailers, wholesale club markets that
service small foodservice operations, small businesses
and individuals, as well as specialty and commodity
distributors who deliver to restaurants, schools and
international markets throughout the world. The Chicken
segment also includes sales from allied products and the
chicken breeding stock subsidiary.
Beef segment is primarily involved in the processing of
live fed cattle and fabrication of dressed beef carcasses
into primal and sub-primal meat cuts and case-ready
products. It also involves deriving value from allied prod-
ucts such as hides and variety meats for sale to further
processors and others. The Beef segment markets its
products to food retailers, distributors, wholesalers,
restaurants, hotel chains and other food processors in
domestic and international markets. Allied products are
also marketed to manufacturers of pharmaceuticals and
technical products.
Pork segment is primarily involved in the processing of
live market hogs and fabrication of pork carcasses into
primal and sub-primal meat cuts and case-ready products.
This segment also represents the Company’s live swine
group and related allied product processing activities.
The Pork segment markets its products to food retailers,
distributors, wholesalers, restaurants, hotel chains and
other food processors in domestic and international
markets. It also sells allied products to pharmaceutical
and technical products manufacturers, as well as live
swine and weaned and feeder pigs to pork producers.
Prepared Foods segment includes the Company’s
operations that manufacture and market frozen and
refrigerated food products. Products include pepperoni,
beef and pork toppings, pizza crusts, flour and corn
tortilla products, appetizers, hors d’oeuvres, desserts,
prepared meals, ethnic foods, soups, sauces, side dishes,
specialty pasta and meat dishes as well as branded and
processed meats. The Prepared Foods segment markets
its products to food retailers, distributors, wholesalers,
restaurants and hotel chains.
Other segment includes the logistics group and other cor-
porate activities not identified with specific protein groups.
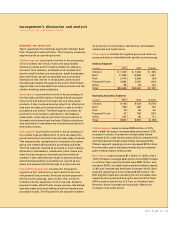
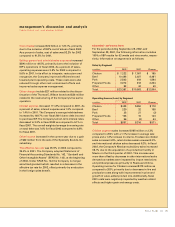
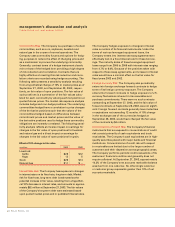
Sales by Segment
in millions 2003 2002 Change
Chicken $ 7,427 $ 7,222 $ 205
Beef 11,935 10,488 1,447
Pork 2,470 2,503 (33)
Prepared Foods 2,662 3,072 (410)
Other 55 82 (27)
Total $24,549 $23,367 $1,182
Operating Income by Segment
in millions 2003 2002 Change
Chicken $ 158 $ 428 $ (270)
Beef 320 220 100
Pork 75 25 50
Prepared Foods 57 158 (101)
Other 227 56 171
Total $ 837 $ 887 $ (50)
Chicken segment sales increased $205 million or 2.8%,
with a slight decrease in average sales prices and a 3.3%
increase in volume. Foodservice chicken sales dollars
increased 4.2%, retail chicken sales dollars increased 2.3%
and international chicken sales dollars decreased 3.6%.
Chicken segment operating income decreased $270 million
from the same period last year primarily due to increased
grain costs and plant closing costs.
Beef segment sales increased $1.4 billion or 13.8%, with a
13.2% increase in average sales prices and a slight increase
in volume. Case-ready beef sales were $957 million and
increased 20.4%, domestic fresh meat beef sales increased
11.8% and international beef sales increased 19.4%. Beef
segment operating income increased $100 million. The
Beef segment sales and operating income increases were
caused by strong demand during the second half of fiscal
2003 caused in part by the U.S. ban on Canadian beef.
However, these increases were partially offset by an
increase in live cattle prices.