Tyson Foods 2003 Annual Report Download - page 48
Download and view the complete annual report
Please find page 48 of the 2003 Tyson Foods annual report below. You can navigate through the pages in the report by either clicking on the pages listed below, or by using the keyword search tool below to find specific information within the annual report.-
 1
1 -
2
-
3
-
4
-
5
-
6
-
7
-
8
-
9
-
10
-
11
-
12
-
13
-
14
-
15
-
16
-
17
-
18
-
19
-
20
-
21
-
22
-
23
-
24
-
25
-
26
-
27
-
28
-
29
-
30
-
31
-
32
-
33
-
34
-
35
-
36
-
37
-
 38
38 -
 39
39 -
 40
40 -
 41
41 -
 42
42 -
 43
43 -
 44
44 -
 45
45 -
 46
46 -
 47
47 -
 48
48 -
 49
49 -
 50
50 -
 51
51 -
 52
52 -
 53
53 -
 54
54 -
 55
55 -
 56
56 -
 57
57 -
 58
58 -
59
-
60
-
61
-
62
-
63
-
64
-
65
-
66
-
67
-
68
-
69
-
70
-
71
-
72
 |
 |

46 Tyson Foods, Inc.
notes to consolidated financial statements
TYSON FOODS, INC. 2003 ANNUAL REPORT
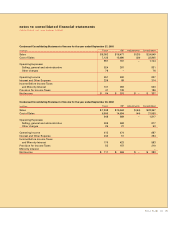
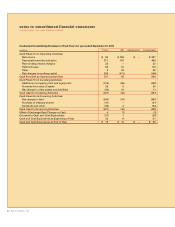
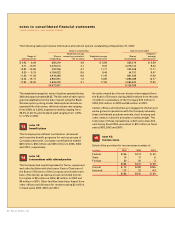
Condensed Consolidating Statement of Income for the year ended September 29, 2001
in millions Tyson IBP Adjustments Consolidated
Sales $ 7,520 $ 3,048 $ (5) $10,563
Cost of Sales 6,764 2,901 (5) 9,660
756 147 – 903
Selling, General and Administrative 510 77 587
Operating Income 246 70 316
Interest and Other Expense 135 16 151
Income Before Income Taxes and Minority Interest 111 54 165
Provision for Income Taxes 40 18 58
Minority Interest 1 18 19
Net Income $ 70 $ 18 $ – $ 88
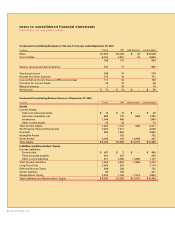
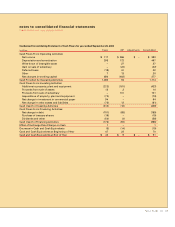
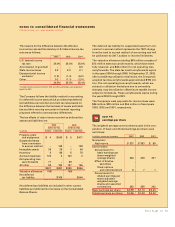
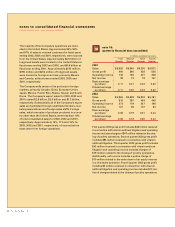
Condensed Consolidating Balance Sheet as of September 27, 2003
in millions Tyson IBP Adjustments Consolidated
Assets
Current Assets:
Cash and cash equivalents $ 15 $ 10 $ – $ 25
Accounts receivable, net 699 747 (166) 1,280
Inventories 1,049 945 1,994
Other current assets 40 32 72
Total Current Assets 1,803 1,734 (166) 3,371
Net Property, Plant and Equipment 2,222 1,817 4,039
Goodwill 960 1,692 2,652
Intangible Assets – 182 182
Other Assets 3,045 103 (2,906) 242
Total Assets $ 8,030 $ 5,528 $ (3,072) $10,486
Liabilities and Shareholders’ Equity
Current Liabilities:
Current debt $ 487 $ 3 $ – $ 490
Trade accounts payable 401 437 838
Other current liabilities 611 2,394 (1,858) 1,147
Total Current Liabilities 1,499 2,834 (1,858) 2,475
Long-Term Debt 2,590 524 3,114
Deferred Income Taxes 486 236 722
Other Liabilities 55 166 221
Shareholders’ Equity 3,400 1,768 (1,214) 3,954
Total Liabilities and Shareholders’ Equity $ 8,030 $ 5,528 $ (3,072) $10,486