Tyson Foods 2003 Annual Report Download - page 55
Download and view the complete annual report
Please find page 55 of the 2003 Tyson Foods annual report below. You can navigate through the pages in the report by either clicking on the pages listed below, or by using the keyword search tool below to find specific information within the annual report.-
 1
1 -
2
-
3
-
4
-
5
-
6
-
7
-
8
-
9
-
10
-
11
-
12
-
13
-
14
-
15
-
16
-
17
-
18
-
19
-
20
-
21
-
22
-
23
-
24
-
25
-
26
-
27
-
28
-
29
-
30
-
31
-
32
-
33
-
34
-
35
-
36
-
37
-
38
-
39
-
40
-
41
-
42
-
43
-
44
-
 45
45 -
 46
46 -
 47
47 -
 48
48 -
 49
49 -
 50
50 -
 51
51 -
 52
52 -
 53
53 -
 54
54 -
 55
55 -
 56
56 -
 57
57 -
 58
58 -
 59
59 -
 60
60 -
 61
61 -
 62
62 -
 63
63 -
 64
64 -
 65
65 -
66
-
67
-
68
-
69
-
70
-
71
-
72
 |
 |

Tyson Foods, Inc. 53
notes to consolidated financial statements
TYSON FOODS, INC. 2003 ANNUAL REPORT
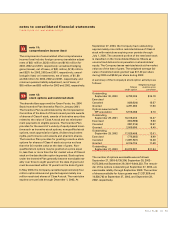
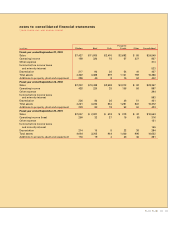
The reasons for the difference between the effective
income tax rate and the statutory U.S. federal income tax
rate are as follows:
2003 2002 2001
U.S. federal income
tax rate 35.0% 35.0% 35.0%
Amortization of goodwill – – 6.5
State income taxes 2.2 3.0 2.1
Extraterritorial income
exclusion1(1.9) (1.4) (6.2)
Other 0.2 (1.1) (2.0)
35.5% 35.5% 35.4%
1 Extraterritorial income exclusion for 2003 and 2002 and foreign sales corporation
benefit for 2001.
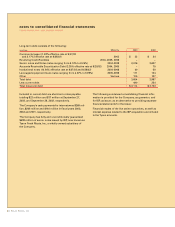
The Company follows the liability method in accounting
for deferred income taxes which provides that deferred
tax liabilities are recorded at current tax rates based on
the difference between the tax basis of assets and liabili-
ties and their carrying amounts for financial reporting
purposes referred to as temporary differences.
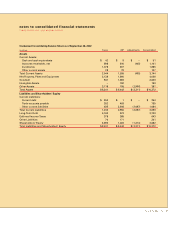
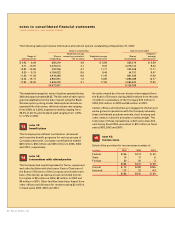
The tax effects of major items recorded as deferred tax
assets and liabilities are:
2003 2002
Deferred Tax Deferred Tax
in millions Assets Liabilities Assets Liabilities
Property, plant
and equipment $ 4 $543 $ 5 $417
Suspended taxes
from conversion
to accrual method – 138 – 138
Intangible assets 28 28 1 64
Inventory 5 86 5 78
Accrued expenses 120 2 122 2
Net operating loss
carryforwards 77 – 69 –
All other 93 190 137 155
$327 $987 $339 $854
Valuation allowance (49) (49)
Net deferred
tax liability $709 $564
Net deferred tax liabilities are included in other current
liabilities and deferred income taxes on the Consolidated
Balance Sheets.
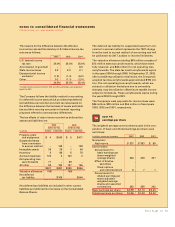
The deferred tax liability for suspended taxes from con-
version to accrual method represents the 1987 change
from the cash to accrual method of accounting and will
be paid down by 2017, subject to income limitations.
The valuation allowance totaling $49 million consists of
$13 million state tax carryforwards, which have been
fully reserved, and $36 million for net operating loss
carryforwards. The state tax credit carryforwards expire
in the years 2004 through 2008. At September 27, 2003,
after considering utilization restrictions, the Company’s
acquired tax loss carryforwards approximated $192 mil-
lion. The net operating loss carryforwards, which are
subject to utilization limitations due to ownership
changes, may be utilized to offset future taxable income
subject to limitations. These carryforwards expire during
the years 2004 through 2022.
The Company’s cash payments for income taxes were
$36 million, $90 million and $54 million in fiscal years
2003, 2002 and 2001, respectively.
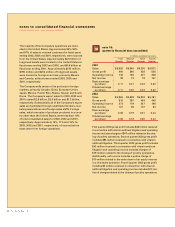
note 16:
earnings per share
The weighted average common shares used in the com-
putation of basic and diluted earnings per share were
as follows:
in millions, except per share data 2003 2002 2001
Numerator:
Net Income $ 337 $ 383 $ 88
Denominator:
Denominator for
basic earnings per
share–weighted
average shares 346 348 221
Effect of dilutive
securities:
Stock options
and restricted stock 6 7 1
Denominator for
diluted earnings per
share–adjusted
weighted average
shares and assumed
conversions 352 355 222
Basic earnings per share $0.98 $1.10 $ 0.40
Diluted earnings per share $0.96 $1.08 $ 0.40
16