Tyson Foods 2003 Annual Report Download - page 6
Download and view the complete annual report
Please find page 6 of the 2003 Tyson Foods annual report below. You can navigate through the pages in the report by either clicking on the pages listed below, or by using the keyword search tool below to find specific information within the annual report.
4Tyson Foods, Inc.
We also have a responsibility to feed people who aren’t able to provide for themselves or their families. I am very
proud of our relationship with Share Our Strength (SOS), one of the nation’s largest anti-hunger organizations.
Since our relationship with SOS began in May 2000, we have donated 15 million pounds of protein. That adds up
to 75 million meals for people in need.
Goals for 2004 Our strong cash flow gives us the ability to pay down debt, expand our product offerings or reinvest
in our existing business through capital expenditures. We will continue to exercise financial discipline by subjecting
investment opportunities to rigorous return on invested capital requirements.
We have made some major steps forward this past year, but we still have work to do. Our goals for the coming year:
•Penetrate and execute the Tyson master brand initiative
•Continue expanding our “one face to the customer” approach
•Create more value-added products toward our goal of 35 to 50 percent in three to five years
•Develop our people
•Continue to evolve our approach to performance-based incentives
•Debt-to-capital of 45 percent in 12 to 18 months
•Average annual double-digit EPS growth
•Improve return on invested capital from 11.1 percent to 14 percent
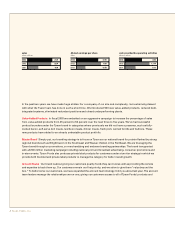
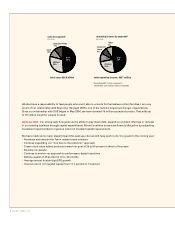
sales by segment
percentage
total sales: $24.5 billion total operating income: $837 million
operating income by segment*
percentage
beef
49%
beef
48%
chicken
24%
prepared
foods
8%
other
9%
pork
11%
chicken
30%
pork
10%
prepared foods
11%
* Excluding $167 million received in
connection with vitamin antitrust litigation

