Tyson Foods 2003 Annual Report Download - page 37
Download and view the complete annual report
Please find page 37 of the 2003 Tyson Foods annual report below. You can navigate through the pages in the report by either clicking on the pages listed below, or by using the keyword search tool below to find specific information within the annual report.-
 1
1 -
2
-
3
-
4
-
5
-
6
-
7
-
8
-
9
-
10
-
11
-
12
-
13
-
14
-
15
-
16
-
17
-
18
-
19
-
20
-
21
-
22
-
23
-
24
-
25
-
26
-
 27
27 -
 28
28 -
 29
29 -
 30
30 -
 31
31 -
 32
32 -
 33
33 -
 34
34 -
 35
35 -
 36
36 -
 37
37 -
 38
38 -
 39
39 -
 40
40 -
 41
41 -
 42
42 -
 43
43 -
 44
44 -
 45
45 -
 46
46 -
 47
47 -
48
-
49
-
50
-
51
-
52
-
53
-
54
-
55
-
56
-
57
-
58
-
59
-
60
-
61
-
62
-
63
-
64
-
65
-
66
-
67
-
68
-
69
-
70
-
71
-
72
 |
 |
Tyson Foods, Inc. 35
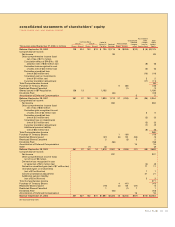
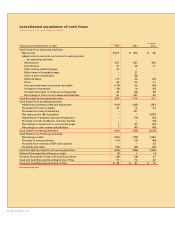
notes to consolidated financial statements
TYSON FOODS, INC. 2003 ANNUAL REPORT
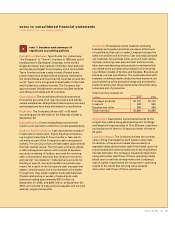
note 1: business and summary of
significant accounting policies
Description of Business: Tyson Foods, Inc. (collectively,
“the Company” or “Tyson”), founded in 1935 with world
headquarters in Springdale, Arkansas, is the world’s
largest processor and marketer of chicken, beef and pork
and the second largest food company in the Fortune 500.
Tyson Foods produces a wide variety of brand name
protein-based and prepared food products marketed in
the United States and more than 80 countries around the
world. Tyson is the recognized market leader in the retail
and foodservice markets it serves. The Company has
approximately 120,000 team members and 300 facilities
and offices in 27 states and 22 countries.
Consolidation: The consolidated financial statements
include the accounts of all majority-owned and wholly-
owned subsidiaries. All significant intercompany accounts
and transactions have been eliminated in consolidation.
Fiscal Year: The Company utilizes a 52- or 53-week
accounting period that ends on the Saturday closest to
September 30.
Reclassifications: Certain reclassifications have been
made to prior periods to conform to current presentations.
Cash and Cash Equivalents: Cash equivalents consist of
investments in short-term, highly liquid securities hav-
ing original maturities of three months or less, which
are made as part of the Company’s cash management
activity. The carrying values of these assets approximate
their fair market values. The Company primarily utilizes
a cash management system with a series of separate
accounts consisting of lockbox accounts for receiving
cash, concentration accounts that funds are moved to,
and several “zero-balance” disbursement accounts for
funding of payroll, accounts payable and grower pay-
ments. As a result of the Company’s cash management
system, checks issued, but not presented to the banks
for payment, may create negative book cash balances.
Checks outstanding in excess of related book cash
balances totaling approximately $313 million at
September 27, 2003, and $292 million at September 28,
2002, are included in trade accounts payable and accrued
salaries, wages and benefits.
1
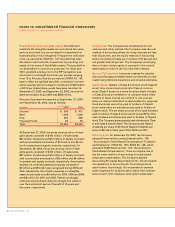
Inventories: Processed products, livestock (excluding
breeders) and supplies and other are valued at the lower
of cost (first-in, first-out) or market. Livestock includes live
cattle, live chicken and live swine. Cost includes purchased
raw materials, live purchase costs, grow-out costs (prima-
rily feed, contract grower pay and catch and haul costs),
labor and manufacturing and production overhead which
are related to the purchase and production of inventories.
Live chicken consists of broilers and breeders. Breeders are
stated as cost less amortization. The costs associated with
breeders, including breeder chicks, feed and medicine, are
accumulated up to the production stage and amortized to
broiler inventory over the productive life of the flock using
a standard unit of production.
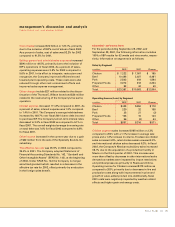
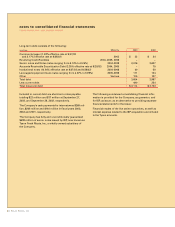
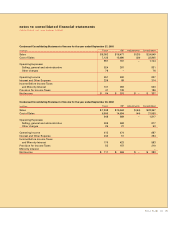
Total inventory consists of:
in millions 2003 2002
Processed products $1,167 $1,112
Livestock 532 505
Supplies and other 295 268
Total inventory $1,994 $1,885
Depreciation: Depreciation is provided primarily by the
straight-line method using estimated lives for buildings
and leasehold improvements of 10 to 39 years, machinery
and equipment of three to 12 years and other of three to
20 years.
Long-Lived Assets: The Company reviews the carrying
value of long-lived assets at each balance sheet date
if indication of impairment exists. Recoverability is
assessed using undiscounted cash flows based upon his-
torical results and current projections of earnings before
interest and taxes. The Company measures impairment
using discounted cash flows of future operating results
based upon a rate that corresponds to the Company’s
cost of capital. Impairments are recognized in operating
results to the extent that carrying value exceeds
discounted cash flows of future operations.