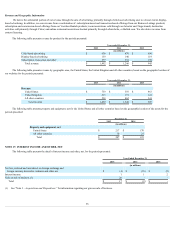
TripAdvisor 2015 Annual Report Download - page 98
Download and view the complete annual report
Please find page 98 of the 2015 TripAdvisor annual report below. You can navigate through the pages in the report by either clicking on the pages listed below, or by using the keyword search tool below to find specific information within the annual report.
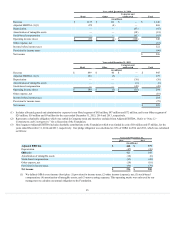
Year ended December 31, 2014
Hotel Other Corporate and
unallocated Total
(in millions)
Revenue $ 1,135 $ 111 $ — $ 1,246
AdjustedEBITDA(1)(3) 472 (4) — 468
Depreciation — — (47) (47)
Amortizationofintangibleassets — — (18) (18)
Stock-basedcompensation — — (63) (63)
Operatingincome(loss) $ 472 $ (4) $ (128) 340
Otherexpense,net (18)
Incomebeforeincometaxes 322
Provisionforincometaxes (96)
Netincome $ 226
Year ended December 31, 2013
Hotel Other Corporate and
unallocated Total
(in millions)
Revenue $ 899 $ 46 $ — $ 945
AdjustedEBITDA(1)(3) 384 (5) — 379
Depreciation — — (30) (30)
Amortizationofintangibleassets — — (6)(6)
Stock-basedcompensation — — (49) (49)
Operatingincome(loss) $ 384 $ (5) $ (85) 294
Otherexpense,net (10)
Incomebeforeincometaxes 284
Provisionforincometaxes (79)
Netincome $ 205
(1) IncludesallocatedgeneralandadministrativeexpensesinourHotelsegmentof$85million,$87millionand$72million;andinourOthersegmentof
$28million,$18millionand$9millionfortheyearsendedDecember31,2015,2014and2013,respectively.
(2) RepresentsacharitableobligationwhichwassettledinCompanystockandthereforeexcludedfromAdjustedEBITDA.Referto“Note12–
Commitments and Contingencies ”foradiscussionoftheFoundation.
(3) HotelsegmentAdjustedEBITDAincludescharitablecontributionstotheFoundationwhichwerefundedincashof$8millionand$7million,forthe
yearsendedDecember31,2014and2013,respectively.Ourpledgeobligationwascalculatedat2.0%ofOIBAin2014and2013,whichwascalculated
asfollows:
Year ended December 31,
2014 2013
(in millions)
Adjusted EBITDA $ 468 $ 379
Depreciation (47) (30)
OIBA (1) 421 349
Amortizationofintangibleassets (18) (6)
Stock-basedcompensation (63) (49)
Otherexpense,net (18) (10)
Provisionforincometaxes (96) (79)
Net income $ 226 $ 205
(1) WedefinedOIBAasnetincome(loss)plus:(1)provisionforincometaxes;(2)otherincome(expense),net;(3)stock-based
compensation;(4)amortizationofintangibleassets;and(5)non-recurringexpenses.Thisoperatingmetricwasonlyusedbyour
managementtocalculateourannualobligationtotheFoundation.
95


