TripAdvisor 2015 Annual Report Download - page 40
Download and view the complete annual report
Please find page 40 of the 2015 TripAdvisor annual report below. You can navigate through the pages in the report by either clicking on the pages listed below, or by using the keyword search tool below to find specific information within the annual report.-
 1
1 -
2
-
3
-
4
-
5
-
6
-
7
-
8
-
9
-
10
-
11
-
12
-
13
-
14
-
15
-
16
-
17
-
18
-
19
-
20
-
21
-
22
-
23
-
24
-
25
-
26
-
27
-
28
-
29
-
 30
30 -
 31
31 -
 32
32 -
 33
33 -
 34
34 -
 35
35 -
 36
36 -
 37
37 -
 38
38 -
 39
39 -
 40
40 -
 41
41 -
 42
42 -
 43
43 -
 44
44 -
 45
45 -
 46
46 -
 47
47 -
 48
48 -
 49
49 -
 50
50 -
51
-
52
-
53
-
54
-
55
-
56
-
57
-
58
-
59
-
60
-
61
-
62
-
63
-
64
-
65
-
66
-
67
-
68
-
69
-
70
-
71
-
72
-
73
-
74
-
75
-
76
-
77
-
78
-
79
-
80
-
81
-
82
-
83
-
84
-
85
-
86
-
87
-
88
-
89
-
90
-
91
-
92
-
93
-
94
-
95
-
96
-
97
-
98
-
99
-
100
-
101
-
102
-
103
-
104
-
105
-
106
-
107
-
108
-
109
-
110
-
111
-
112
-
113
-
114
-
115
 |
 |

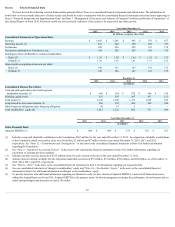
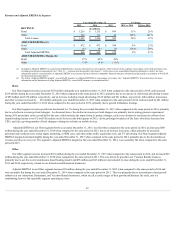
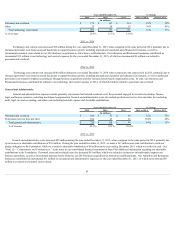
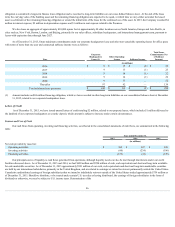
Year ended December 31, % Change
2015 2014 2013 2015 vs 2014 2014 vs 2013
(in millions)
Click-basedadvertising $ 956 $ 870 $ 696 10% 25%
Display-basedadvertising 159 140 119 14% 18%
Subscription,transactionandother* 377 236 130 60% 82%
Totalrevenue $ 1,492 $ 1,246 $ 945 20% 32%
* SubstantiallyallrevenuereportedinourOthersegmentisfromoursubscription,transactionandotherproducts.
2015 vs. 2014
Revenueincreased$246millionduringtheyearendedDecember31,2015whencomparedtothesameperiodin2014,primarilyduetoanincreaseinclick-
basedadvertisingrevenueof$86million.Theprimarydriveroftheincreaseinclick-basedadvertisingrevenuewasanincreaseinhotelshoppersof16%,partially
offsetbyadecreaseinrevenueperhotelshopperof6%fortheyearendedDecember31,2015.Display-basedadvertisingincreasedby$19millionduringtheyear
endedDecember31,2015,primarilyasaresultofa14%increaseinthenumberofimpressionssoldwhencomparedtothesameperiodin2014,partiallyoffsetby
adecreaseinpricingby1%forthesameperiod.Subscription,transactionandotherrevenueincreasedby$141millionduringtheyearendedDecember31,2015,
primarilyduetogrowthinAttractions,Restaurants,BusinessListings,andVacationRentals,whichincludesincrementalrevenuefortheyearendedDecember31,
2015of$96million,relatedtoourAttractionandRestaurantbusinesses.
2014 vs. 2013
Revenueincreased$301millionduringtheyearendedDecember31,2014whencomparedtothesameperiodin2013,primarilyduetoanincreasein
click-basedadvertisingrevenueof$174million.Theprimarydriveroftheincreaseinclick-basedadvertisingrevenuewasanincreaseinhotelshoppersof10%
andanincreaseinrevenueperhotelshopperof15%fortheyearendedDecember31,2014.Display-basedadvertisingincreasedby$21millionduringtheyear
endedDecember31,2014,primarilyasaresultofa19%increaseinthenumberofimpressionssoldwhencomparedtothesameperiodin2013,partiallyoffsetby
adecreaseinpricingby1%forthesameperiod.Subscription,transactionandotherrevenueincreasedby$106millionduringtheyearendedDecember31,2014,
primarilyduetogrowthinBusinessListingsandVacationRentals,aswellasrevenuegeneratedbythebusinessesweacquiredduring2014of$43million.
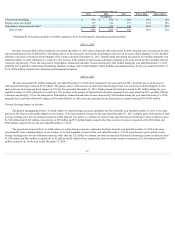
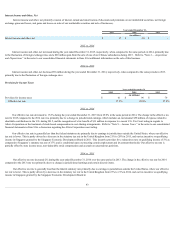
Foreign Exchange Impact on Revenue
ThegeneralstrengtheningoftheU.S.dollarrelativetocertainforeigncurrencies(primarilytheEuro)fromtheyearendedDecember31,2015tothesame
periodsin2014hadanunfavorableimpactonourrevenue.IfwehadtranslatedrevenuefortheyearendedDecember31,2015usingtheprioryear'squartertodate
averageexchangeratesforoursettlementcurrenciesotherthantheU.S.dollar,weestimateourtotalrevenueandclick-basedadvertisingrevenuewouldhavebeen
$1,584millionand$1,027million,respectively,or$92millionand$71millionhigher,respectively,thanouractualrevenueasreported,of$1,492millionand
$956million,respectively,fortheyearendedDecember31,2015.
ThegeneralmovementoftheU.S.dollarrelativetocertainforeigncurrencies(primarilytheEuro)fromtheyearendedDecember31,2014tothesame
periodsin2013hadaminimalimpactonourrevenue.IfwehadtranslatedrevenuefortheyearendedDecember31,2014usingtheprioryear'squartertodate
averageexchangeratesforoursettlementcurrenciesotherthantheU.S.dollar,weestimateourtotalrevenueandclick-basedadvertisingrevenuewouldhavebeen
$1,244millionand$869million,respectively,or$2millionand$1millionlower,respectively,thanouractualrevenueasreported,of$1,246millionand$870
million,respectively,fortheyearendedDecember31,2014.
37