TripAdvisor 2015 Annual Report Download - page 32
Download and view the complete annual report
Please find page 32 of the 2015 TripAdvisor annual report below. You can navigate through the pages in the report by either clicking on the pages listed below, or by using the keyword search tool below to find specific information within the annual report.-
 1
1 -
2
-
3
-
4
-
5
-
6
-
7
-
8
-
9
-
10
-
11
-
12
-
13
-
14
-
15
-
16
-
17
-
18
-
19
-
20
-
21
-
 22
22 -
 23
23 -
 24
24 -
 25
25 -
 26
26 -
 27
27 -
 28
28 -
 29
29 -
 30
30 -
 31
31 -
 32
32 -
 33
33 -
 34
34 -
 35
35 -
 36
36 -
 37
37 -
 38
38 -
 39
39 -
 40
40 -
 41
41 -
 42
42 -
43
-
44
-
45
-
46
-
47
-
48
-
49
-
50
-
51
-
52
-
53
-
54
-
55
-
56
-
57
-
58
-
59
-
60
-
61
-
62
-
63
-
64
-
65
-
66
-
67
-
68
-
69
-
70
-
71
-
72
-
73
-
74
-
75
-
76
-
77
-
78
-
79
-
80
-
81
-
82
-
83
-
84
-
85
-
86
-
87
-
88
-
89
-
90
-
91
-
92
-
93
-
94
-
95
-
96
-
97
-
98
-
99
-
100
-
101
-
102
-
103
-
104
-
105
-
106
-
107
-
108
-
109
-
110
-
111
-
112
-
113
-
114
-
115
 |
 |

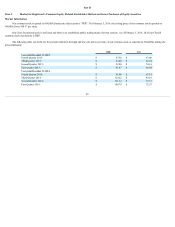
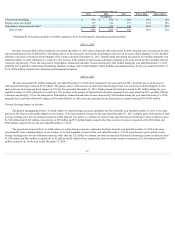
Ite m 6. Selected Financial Data
Wehavederivedthefollowingselectedfinancialdatapresentedbelowfromourconsolidatedfinancialstatementsandrelatednotes.Theinformationset
forthbelowisnotnecessarilyindicativeoffutureresultsandshouldbereadinconjunctionwiththeconsolidatedfinancialstatementsandrelatednotesappearingin
Item8.“FinancialStatementsandSupplementaryData”andItem7.“Management’sDiscussionandAnalysisofFinancialConditionandResultsofOperations”of
thisAnnualReportonForm10-K.Historicalresultsarenotnecessarilyindicativeoftheresultstobeexpectedinanyfutureperiod.
Year Ended December 31,
2015 2014 2013 2012 2011
(in millions, except per share data)
Consolidated Statements of Operations Data:
Revenue $ 1,492 $ 1,246 $ 945 $ 763 $ 637
Operatingincome(1) 232 340 294 296 273
NetIncome 198 226 205 195 178
NetincomeattributabletoTripAdvisor,Inc. 198 226 205 194 178
Earningspershareattributabletocommonstockholders:
Basic(2) $ 1.38 $ 1.58 $ 1.44 $ 1.39 $ 1.33
Diluted(2) 1.36 1.55 1.41 1.37 1.32
Sharesusedincomputingnetincomepershare:
Basic(2) 144 143 143 139 133
Diluted(2) 146 146 145 141 135
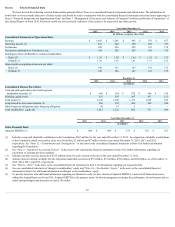
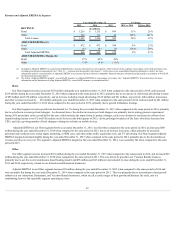
December 31,
2015 2014 2013 2012 2011
(in millions)
Consolidated Balance Sheet Data:
Cashandcashequivalents,shortandlongterm
marketablesecurities(3) $ 698 $ 594 $ 670 $ 586 $ 184
Workingcapital(3)(4) 553 356 387 437 152
Totalassets(3) 2,128 1,948 1,473 1,299 836
Long-termdebt,lesscurrentportion(5) 200 259 300 340 380
Otherlong-termobligationsunderfinancingobligation 84 67 8 — —
Totalstockholders’equity(6) 1,412 1,125 865 727 294
Year Ended December 31,
2015 2014 2013 2012 2011
(in millions)
Other Financial Data:
AdjustedEBITDA(7) $ 466 $ 468 $ 379 $ 352 $ 323
(1) Includesanon-cashcharitablecontributiontotheFoundationof$67millionfortheyearendedDecember31,2015.Incomparison,charitablecontributions
totheFoundation,whichwerepaidincash,were$8million,$7millionand$7millionfortheyearsendedDecember31,2014,2013,and2012,
respectively.See“Note12—Commitments and Contingencies ”inthenotestotheconsolidatedfinancialstatementsinItem8forfurtherinformation
regardingtheFoundation.
(2) See“Note2—Significant Accounting Policies ”inthenotestotheconsolidatedfinancialstatementsinItem8forfurtherinformationregardingour
calculationofearningspersharenumbers.
(3) Includesone-timeexerciseproceedsof$215millionrelatedtostockwarrantexercisesfortheyearendedDecember31,2012.
(4) Amountdoesnotincludeavailableforsalelong-termmarketablesecuritiesof$37million,$31million,$188million,and$99million,asofDecember31,
2015,2014,2013,and2012,respectively.
(5) See“Note8—Debt ”inthenotestotheconsolidatedfinancialstatementsinItem8forinformationregardingourlong-termdebt.
(6) Seeourconsolidatedstatementsofchangesinstockholders’equityand“Note14—Stockholders’ Equity ”inthenotestotheconsolidatedfinancial
statementsinItem8foradditionalinformationonchangestoourstockholders’equity.
(7) Toprovideinvestorswithadditionalinformationregardingourfinancialresults,wehavedisclosedAdjustedEBITDA,anon-GAAPfinancialmeasure,
withinthisAnnualReportonForm10-K.AdjustedEBITDAistheprimarymetricbywhichmanagementevaluatestheperformanceofourbusinessandon
whichinternalbudgetsandforecastsarebased.Wedefine
29