TripAdvisor 2015 Annual Report Download - page 38
Download and view the complete annual report
Please find page 38 of the 2015 TripAdvisor annual report below. You can navigate through the pages in the report by either clicking on the pages listed below, or by using the keyword search tool below to find specific information within the annual report.-
 1
1 -
2
-
3
-
4
-
5
-
6
-
7
-
8
-
9
-
10
-
11
-
12
-
13
-
14
-
15
-
16
-
17
-
18
-
19
-
20
-
21
-
22
-
23
-
24
-
25
-
26
-
27
-
 28
28 -
 29
29 -
 30
30 -
 31
31 -
 32
32 -
 33
33 -
 34
34 -
 35
35 -
 36
36 -
 37
37 -
 38
38 -
 39
39 -
 40
40 -
 41
41 -
 42
42 -
 43
43 -
 44
44 -
 45
45 -
 46
46 -
 47
47 -
 48
48 -
49
-
50
-
51
-
52
-
53
-
54
-
55
-
56
-
57
-
58
-
59
-
60
-
61
-
62
-
63
-
64
-
65
-
66
-
67
-
68
-
69
-
70
-
71
-
72
-
73
-
74
-
75
-
76
-
77
-
78
-
79
-
80
-
81
-
82
-
83
-
84
-
85
-
86
-
87
-
88
-
89
-
90
-
91
-
92
-
93
-
94
-
95
-
96
-
97
-
98
-
99
-
100
-
101
-
102
-
103
-
104
-
105
-
106
-
107
-
108
-
109
-
110
-
111
-
112
-
113
-
114
-
115
 |
 |

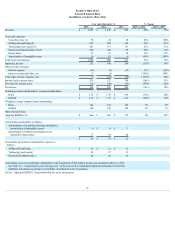
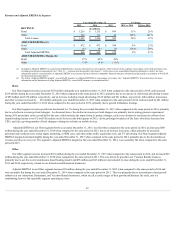
Results of Operations
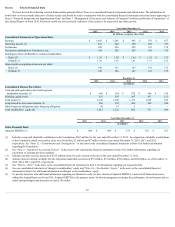
Selected Financial Data
(in millions, except per share data)
Year ended December 31, % Change
2015 2014 2013 2015 vs. 2014 2014 vs. 2013
Revenue $ 1,492 $ 1,246 $ 945 20% 32%
Costsandexpenses:
Costofrevenue(1) 58 40 18 45% 122%
Sellingandmarketing(2) 692 502 368 38% 36%
Technologyandcontent(2) 207 171 131 21% 31%
Generalandadministrative(2)(3) 210 128 98 64% 31%
Depreciation 57 47 30 21% 57%
Amortizationofintangibleassets 36 18 6 100% 200%
Totalcostsandexpenses 1,260 906 651 39% 39%
Operatingincome 232 340 294 (32)% 16%
Otherincome(expense):
Interestexpense (10) (9) (10) 11% (10)%
Interestincomeandother,net 17 (9) - (289)% 100%
Totalotherincome(expense),net 7 (18) (10) (139)% 80%
Incomebeforeincometaxes 239 322 284 (26)% 13%
Provisionforincometaxes (41) (96) (79) (57)% 22%
Netincome $ 198 $ 226 $ 205 (12)% 10%
Earningspershareattributabletocommonstockholders:
Basic $ 1.38 $ 1.58 $ 1.44 (13)% 10%
Diluted $ 1.36 $ 1.55 $ 1.41 (12)% 10%
Weightedaveragecommonsharesoutstanding:
Basic 144 143 143 1% 0%
Diluted 146 146 145 0% 1%
Otherfinancialdata:
AdjustedEBITDA(4) $ 466 $ 468 $ 379 0% 23%
(1)Excludesamortizationasfollows:
Amortizationofacquiredtechnologyincludedin
amortizationofintangiblesassets $ 9 $ 4 $ 1
Amortizationofwebsitedevelopmentcosts
includedindepreciation 37 30 20
$ 46 $ 34 $ 21
(2)Includesstock-basedcompensationexpenseas
follows:
Sellingandmarketing $ 16 $ 13 $ 11
Technologyandcontent 28 27 21
Generalandadministrative 28 23 17
(3)Includesanon-cashcharitablecontributiontotheFoundationof$67millionfortheyearendedDecember31,2015.
See“Note12—Commitments and Contingencies ”inthenotestotheconsolidatedfinancialstatementsinItem8for
additionalinformationregardingourcharitablecontributionstotheFoundation.
(4)See“AdjustedEBITDA”discussionbelowformoreinformation.
35