TripAdvisor 2015 Annual Report Download - page 44
Download and view the complete annual report
Please find page 44 of the 2015 TripAdvisor annual report below. You can navigate through the pages in the report by either clicking on the pages listed below, or by using the keyword search tool below to find specific information within the annual report.-
 1
1 -
2
-
3
-
4
-
5
-
6
-
7
-
8
-
9
-
10
-
11
-
12
-
13
-
14
-
15
-
16
-
17
-
18
-
19
-
20
-
21
-
22
-
23
-
24
-
25
-
26
-
27
-
28
-
29
-
30
-
31
-
32
-
33
-
 34
34 -
 35
35 -
 36
36 -
 37
37 -
 38
38 -
 39
39 -
 40
40 -
 41
41 -
 42
42 -
 43
43 -
 44
44 -
 45
45 -
 46
46 -
 47
47 -
 48
48 -
 49
49 -
 50
50 -
 51
51 -
 52
52 -
 53
53 -
 54
54 -
55
-
56
-
57
-
58
-
59
-
60
-
61
-
62
-
63
-
64
-
65
-
66
-
67
-
68
-
69
-
70
-
71
-
72
-
73
-
74
-
75
-
76
-
77
-
78
-
79
-
80
-
81
-
82
-
83
-
84
-
85
-
86
-
87
-
88
-
89
-
90
-
91
-
92
-
93
-
94
-
95
-
96
-
97
-
98
-
99
-
100
-
101
-
102
-
103
-
104
-
105
-
106
-
107
-
108
-
109
-
110
-
111
-
112
-
113
-
114
-
115
 |
 |

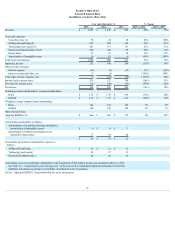
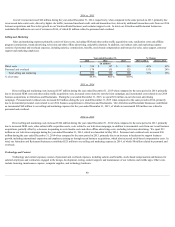
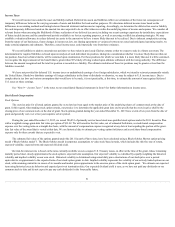
Year ended December 31, % Change
2015 2014 2013 2015 vs 2014 2014 vs 2013
(in millions)
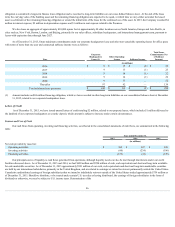
Personnelandoverhead $ 174 $ 147 $ 114 18% 29%
Other 33 24 17 38% 41%
Totaltechnologyandcontent $ 207 $ 171 $ 131 21% 31%
%ofrevenue 13.9% 13.7% 13.9%
2015 vs. 2014
Technologyandcontentcostsincreased$36millionduringtheyearendedDecember31,2015whencomparedtothesameperiodin2014,primarilydueto
increasedpersonnelcostsfromincreasedheadcounttosupportbusinessgrowth,includinginternationalexpansionandenhancedsitefeatures,aswellas
incrementalpersonnelcostsrelatedtoour2014businessacquisitionsinAttractionsandRestaurants.OurAttractionandRestaurantbusinessescontributedan
incremental$15milliontoourtechnologyandcontentexpensesfortheyearendedDecember31,2015,ofwhichanincremental$9millionwasrelatedto
personnelandoverhead.
2014 vs. 2013
Technologyandcontentcostsincreased$40millionduringtheyearendedDecember31,2014whencomparedtothesameperiodin2013,primarilydueto
increasedpersonnelcostsfromincreasedheadcounttosupportbusinessgrowth,includinginternationalexpansionandenhancedsitefeatures,aswellasadditional
personnelcostsrelatedtoemployeesjoiningusthroughbusinessacquisitionsandalsoincreasedstock-basedcompensationcosts.Intotal,ourAttractionand
Restaurantbusinessescontributed$6milliontoourtechnologyandcontentexpensein2014,ofwhich$4millionrelatedtopersonnelandoverhead.
General and Administrative
Generalandadministrativeexpenseconsistsprimarilyofpersonnelandrelatedoverheadcosts,forpersonnelengagedinexecutiveleadership,finance,
legal,andhumanresources,includingstock-basedcompensation.Generalandadministrativecostsalsoincludeprofessionalservicefeesandotherfeesincluding
audit,legal,taxandaccounting,andothercostsincludingbaddebtexpenseandcharitablecontributions.
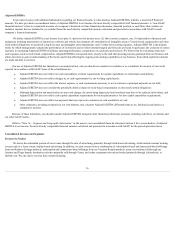
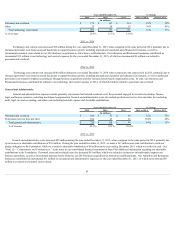
Year ended December 31, % Change
2015 2014 2013 2015 vs 2014 2014 vs 2013
(in millions)
Personnelandoverhead $ 106 $ 87 $ 66 22% 32%
Professionalservicefeesandother 104 41 32 154% 28%
Totalgeneralandadministrative $ 210 $ 128 $ 98 64% 31%
%ofrevenue 14.1% 10.3% 10.4%
2015 vs. 2014
Generalandadministrativecostsincreased$82millionduringtheyearendedDecember31,2015,whencomparedtothesameperiodin2014,primarilydue
toanincreaseincharitablecontributionsof$59million.DuringtheyearendedDecember31,2015,wemadea$67millionnon-cashcontributiontosettleour
pledgeobligationtotheFoundation,whilewerecordedacharitablecontributionof$8millionintheyearendingDecember2014,whichwassettledincash.See
“Note12—Commitments and Contingencies ”inthenotestoourconsolidatedfinancialstatementsinItem8foradditionalinformationregardingourcharitable
contributionstotheFoundation.Personnelcostsandoverheadcostsalsoincreased$19million,whichwasrelatedtoanincreaseinheadcounttosupportour
businessoperations,aswellasincrementalpersonnelcostsrelatedtoour2014businessacquisitionsinAttractionsandRestaurants.OurAttractionandRestaurant
businessescontributedanincremental$11milliontoourgeneralandadministrativeexpensesfortheyearendedDecember31,2015,ofwhichanincremental$8
millionwasrelatedtopersonnelandoverhead.
41