TripAdvisor 2015 Annual Report Download - page 41
Download and view the complete annual report
Please find page 41 of the 2015 TripAdvisor annual report below. You can navigate through the pages in the report by either clicking on the pages listed below, or by using the keyword search tool below to find specific information within the annual report.-
 1
1 -
2
-
3
-
4
-
5
-
6
-
7
-
8
-
9
-
10
-
11
-
12
-
13
-
14
-
15
-
16
-
17
-
18
-
19
-
20
-
21
-
22
-
23
-
24
-
25
-
26
-
27
-
28
-
29
-
30
-
 31
31 -
 32
32 -
 33
33 -
 34
34 -
 35
35 -
 36
36 -
 37
37 -
 38
38 -
 39
39 -
 40
40 -
 41
41 -
 42
42 -
 43
43 -
 44
44 -
 45
45 -
 46
46 -
 47
47 -
 48
48 -
 49
49 -
 50
50 -
 51
51 -
52
-
53
-
54
-
55
-
56
-
57
-
58
-
59
-
60
-
61
-
62
-
63
-
64
-
65
-
66
-
67
-
68
-
69
-
70
-
71
-
72
-
73
-
74
-
75
-
76
-
77
-
78
-
79
-
80
-
81
-
82
-
83
-
84
-
85
-
86
-
87
-
88
-
89
-
90
-
91
-
92
-
93
-
94
-
95
-
96
-
97
-
98
-
99
-
100
-
101
-
102
-
103
-
104
-
105
-
106
-
107
-
108
-
109
-
110
-
111
-
112
-
113
-
114
-
115
 |
 |

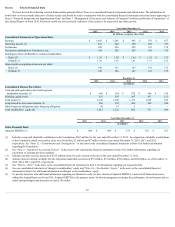
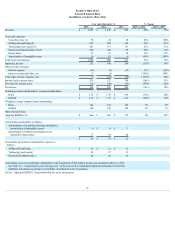
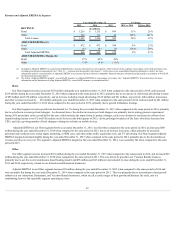
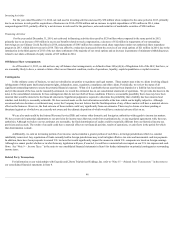
Revenue and Adjusted EBITDA by Segment
Year ended December 31, % Change
2015 2014 2013 2015 vs. 2014 2014 vs. 2013
REVENUE: (in millions)
Hotel $ 1,263 $ 1,135 $ 899 11% 26%
Other 229 111 46 106% 141%
Totalrevenue $ 1,492 $ 1,246 $ 945 20% 32%
ADJUSTED EBITDA (1):
Hotel $ 472 $ 472 $ 384 0% 23%
Other (6) (4) (5) (50)% 20%
TotalAdjustedEBITDA $ 466 $ 468 $ 379 0% 23%
ADJUSTED EBITDA Margin (2):
Hotel 37% 42% 43%
Other (3)% (4)% (11)%
(1) IncludedinAdjustedEBITDAisageneralandadministrativeexpenseallocationforeachsegment,whichisbasedonthesegment’spercentageofourtotalpersonnelcosts,
excludingstock-basedcompensation.See“Note16 — Segment and Geographic Information ,”inthenotestoourconsolidatedfinancialstatementsinItem8formore
informationandforareconciliationofAdjustedEBITDAtonetincome,themostdirectlycomparablefinancialmeasurecalculatedandpresentedinaccordancewithGAAP,
fortheperiodspresentedabove.
(2) Wedefine“AdjustedEBITDAmargin”,anon-GAAPmeasure,asAdjustedEBITDAasapercentageofrevenue.See“AdjustedEBITDA”discussionaboveformore
informationonthelimitationsofusingAdjustedEBITDA,anon-GAAPmeasure,asananalyticaltool.
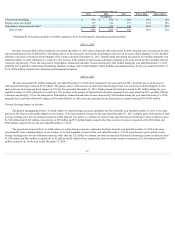
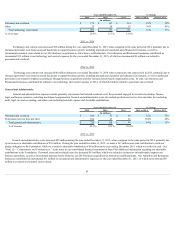
Hotel
OurHotelsegmentrevenueincreased$128millionduringtheyearendedDecember31,2015whencomparedtothesameperiodin2014,andincreased
$236millionduringtheyearendedDecember31,2014whencomparedtothesameperiodin2013,primarilyduetoanincreaseinclick-basedadvertisingrevenue
of$86millionand$174million,respectively,andanincreaseindisplay-basedadvertisingof$19millionand$21million,respectively.Subscription,transaction
andotherrevenueincreasedby$23millionduringtheyearendedDecember31,2015whencomparedtothesameperiodin2014,andincreasedby$41million
duringtheyearendedDecember31,2014whencomparedtothesameperiodin2013,primarilyduetogrowthinBusinessListings.
OurHotelsegmentrevenuegrowthratedeceleratedto11%duringtheyearendedDecember31,2015whencomparedtothesameperiodin2014,primarily
duetoadeclineinrevenueperhotelshopper.Asdiscussedabove,thedeclineinrevenueperhotelshopperwasprimarilyduetopricingpressureexperienced
during2015particularlyinthesecondhalfoftheyear;whichincludestheimpactfrom(i)productchanges,suchasourdecisiontoacceleratetherolloutofour
instantbookingfeaturetoourUSandUKmarketsonalldevicesinthethirdquarterof2015,(ii)theprolongedweaknessoftheEuro,whichhasdecreasedour
CPCs,and(iii)agrowingnumberofhotelshoppersvisitingourwebsitesonmobiledevices.
AdjustedEBITDAinourHotelsegmentfortheyearendedDecember31,2015,wasflatwhencomparedtothesameperiodin2014,andincreased$88
millionduringtheyearendedDecember31,2014whencomparedtothesameperiodin2013,duetoanincreaseinrevenue,offsetprimarilybyincreased
personnelandoverheadcosts,searchenginemarketing,orSEMcosts,andotheronlinetrafficacquisitioncosts,andTVadvertising.OurHotelsegmentadjusted
EBITDAmargindeceleratedslightlyduringtheyearendedDecember31,2015whencomparedtothesameperiodin2014,primarilyduetothedecelerationin
revenuegrowthyearoveryear.Thesegment’sAdjustedEBITDAmarginfortheyearendedDecember31,2014,wasessentiallyflatwhencomparedtothesame
periodin2013.
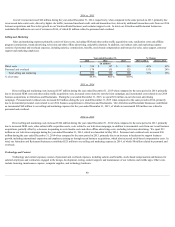
Other
OurOthersegmentrevenueincreased$118millionduringtheyearendedDecember31,2015whencomparedtothesameperiodin2014,andincreased$65
millionduringtheyearendedDecember31,2014whencomparedtothesameperiodin2013.ThiswasdrivenbygrowthinourVacationRentalsbusiness,
primarilyduetoourfree-to-listcommission-basedbookingmodel,and$96millionand$43millioninincrementalrevenueduringtheyearsendedDecember31,
2015and2014,respectively,relatedtoourAttractionandRestaurantbusinesses.
AdjustedEBITDAinourOthersegmentdecreased$2millionduringtheyearendedDecember31,2015whencomparedtothesameperiodin2014and
wasessentiallyflatduringtheyearendedDecember31,2014whencomparedtothesameperiodin2013.Thiswasprimarilyduetoinvestmentstofundgrowth
initiativesatourAttractions,Restaurants,andVacationRentalsbusinesses,whichareallatearlierstagesoftheirgrowthandbusinesslifecycle,andisa
contributingfactortothisreportablesegmentoperatingataloss.
38