TripAdvisor 2015 Annual Report Download - page 42
Download and view the complete annual report
Please find page 42 of the 2015 TripAdvisor annual report below. You can navigate through the pages in the report by either clicking on the pages listed below, or by using the keyword search tool below to find specific information within the annual report.-
 1
1 -
2
-
3
-
4
-
5
-
6
-
7
-
8
-
9
-
10
-
11
-
12
-
13
-
14
-
15
-
16
-
17
-
18
-
19
-
20
-
21
-
22
-
23
-
24
-
25
-
26
-
27
-
28
-
29
-
30
-
31
-
 32
32 -
 33
33 -
 34
34 -
 35
35 -
 36
36 -
 37
37 -
 38
38 -
 39
39 -
 40
40 -
 41
41 -
 42
42 -
 43
43 -
 44
44 -
 45
45 -
 46
46 -
 47
47 -
 48
48 -
 49
49 -
 50
50 -
 51
51 -
 52
52 -
53
-
54
-
55
-
56
-
57
-
58
-
59
-
60
-
61
-
62
-
63
-
64
-
65
-
66
-
67
-
68
-
69
-
70
-
71
-
72
-
73
-
74
-
75
-
76
-
77
-
78
-
79
-
80
-
81
-
82
-
83
-
84
-
85
-
86
-
87
-
88
-
89
-
90
-
91
-
92
-
93
-
94
-
95
-
96
-
97
-
98
-
99
-
100
-
101
-
102
-
103
-
104
-
105
-
106
-
107
-
108
-
109
-
110
-
111
-
112
-
113
-
114
-
115
 |
 |

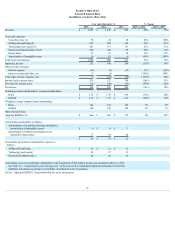
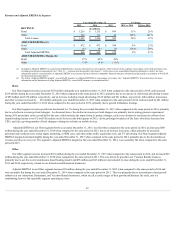
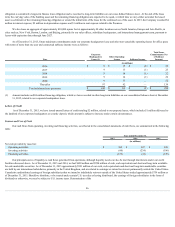
Revenue by Geography
Thefollowingtablepresentsourrevenuebygeographicregion,whichreflectshowweviewourgeographicrevenueinternally.Revenuebygeographyis
basedonthegeographiclocationofourwebsites:
Year ended December 31, % Change
2015 2014 2013 2015 vs 2014 2014 vs 2013
(in millions)
Revenue by geographic region:
NorthAmerica(1) $ 775 $ 629 $ 494 23% 27%
EMEA(2) 473 405 291 17% 39%
APAC(3) 172 156 122 10% 28%
LATAM(4) 72 56 38 29% 47%
Total $ 1,492 $ 1,246 $ 945 20% 32%
(1) UnitedStatesandCanada*
(2) Europe,MiddleEastandAfrica
(3) Asia-Pacific
(4) LatinAmerica
* Canadaisincludedininternationalrevenuebelowfordiscussionpurposes.
Internationalrevenueincreased$100millionand$171millionduringtheyearsendedDecember31,2015and2014,respectively,comparedtothesame
periodsin2014and2013.Internationalrevenuerepresented50%,52%,and51%oftotalrevenueduringtheyearsendedDecember31,2015,2014,and2013,
respectively.Althoughinternationalrevenueincreased,ourinternationalrevenuegrowthratedeceleratedandinternationalrevenue,asapercentageoftotal
revenue,declinedslightlyduringtheyearendedDecember31,2015whencomparedtothesameperiodsin2014and2013,primarilyduetotheimpactof
fluctuationsinforeignexchangerates,specificallytheprolongedweaknessoftheEuro,inadditiontoouracceleratedrolloutofinstantbookingintheU.K.during
2015andgenerallylowerCPC’s,ormonetization,inmarketsoutsidetheU.S.overall.
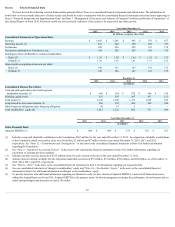
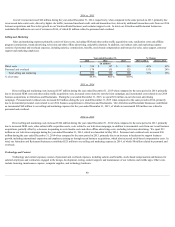
Consolidated Expenses
Cost of Revenue
Costofrevenueconsistsofexpensesthataredirectlyrelatedorcloselycorrelatedtorevenuegeneration,includingdirectcosts,suchasadservingfees,
flightsearchfees,transactionfeesanddatacentercosts.Inaddition,costofrevenueincludespersonnelandoverheadexpenses,includingsalaries,benefits,stock-
basedcompensationandbonusesforcertaincustomersupportpersonnelwhoaredirectlyinvolvedinrevenuegeneration.
Year ended December 31, % Change
2015 2014 2013 2015 vs 2014 2014 vs 2013
(in millions)
Directcosts $ 43 $ 31 $ 18 39% 72%
Personnelandoverhead 15 9 - 67% 100%
Totalcostofrevenue $ 58 $ 40 $ 18 45% 122%
%ofrevenue 3.9% 3.2% 1.9%
2015 vs. 2014
Costofrevenueincreased$18millionduringtheyearendedDecember31,2015,respectively,whencomparedtothesameperiodsin2014,primarilydue
toincreasedmerchantcreditcardandtransactionfees,drivenbyadditionaltransactioncostsfromour2014businessacquisitionsinAttractionsandRestaurantsand
growthinourVacationRentalfree-to-listbusiness;increasedpersonnelcostsfromadditionalheadcounttosupportbusinessgrowthandcustomersupport;and
incrementalpersonnelcostsrelatedtoAttractionsandRestaurants.OurAttractionandRestaurantbusinessescontributedanincremental$15milliontoourcostof
revenuefortheyearendedDecember31,2015,ofwhichanincremental$6millionwasrelatedtopersonnelandoverhead.
39