TripAdvisor 2015 Annual Report Download - page 43
Download and view the complete annual report
Please find page 43 of the 2015 TripAdvisor annual report below. You can navigate through the pages in the report by either clicking on the pages listed below, or by using the keyword search tool below to find specific information within the annual report.-
 1
1 -
2
-
3
-
4
-
5
-
6
-
7
-
8
-
9
-
10
-
11
-
12
-
13
-
14
-
15
-
16
-
17
-
18
-
19
-
20
-
21
-
22
-
23
-
24
-
25
-
26
-
27
-
28
-
29
-
30
-
31
-
32
-
 33
33 -
 34
34 -
 35
35 -
 36
36 -
 37
37 -
 38
38 -
 39
39 -
 40
40 -
 41
41 -
 42
42 -
 43
43 -
 44
44 -
 45
45 -
 46
46 -
 47
47 -
 48
48 -
 49
49 -
 50
50 -
 51
51 -
 52
52 -
 53
53 -
54
-
55
-
56
-
57
-
58
-
59
-
60
-
61
-
62
-
63
-
64
-
65
-
66
-
67
-
68
-
69
-
70
-
71
-
72
-
73
-
74
-
75
-
76
-
77
-
78
-
79
-
80
-
81
-
82
-
83
-
84
-
85
-
86
-
87
-
88
-
89
-
90
-
91
-
92
-
93
-
94
-
95
-
96
-
97
-
98
-
99
-
100
-
101
-
102
-
103
-
104
-
105
-
106
-
107
-
108
-
109
-
110
-
111
-
112
-
113
-
114
-
115
 |
 |

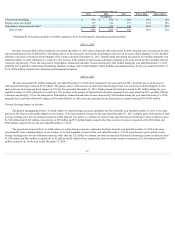
2014 vs. 2013
Costofrevenueincreased$22millionduringtheyearendedDecember31,2014,respectively,whencomparedtothesameperiodsin2013,primarilydue
toincreaseddatacentercosts,drivenbyhighersitetraffic;increasedmerchantcreditcardandtransactionfees,drivenbyadditionaltransactioncostsfromour2014
businessacquisitionsandfree-to-listgrowthinourVacationRentalbusiness;andcustomersupportcosts.Intotal,ourAttractionandRestaurantbusinesses
contributed$6milliontoourcostofrevenuein2014,ofwhich$3millionrelatedtopersonnelandoverhead.
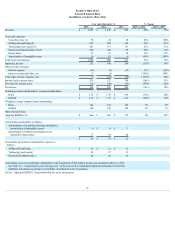
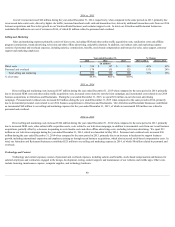
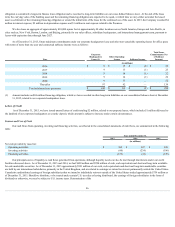
Selling and Marketing
Salesandmarketingexpensesprimarilyconsistofdirectcosts,includingSEMandotheronlinetrafficacquisitioncosts,syndicationcostsandaffiliate
programcommissions,brandadvertising,televisionandotherofflineadvertising,andpublicrelations.Inaddition,ourindirectsalesandmarketingexpense
consistsofpersonnelandoverheadexpenses,includingsalaries,commissions,benefits,stock-basedcompensationandbonusesforsales,salessupport,customer
supportandmarketingemployees.
Year ended December 31, % Change
2015 2014 2013 2015 vs 2014 2014 vs 2013
(in millions)
Directcosts $ 514 $ 347 $ 243 48% 43%
Personnelandoverhead 178 155 125 15% 24%
Totalsellingandmarketing $ 692 $ 502 $ 368 38% 36%
%ofrevenue 46.4% 40.3% 38.9%
2015 vs. 2014
Directsellingandmarketingcostsincreased$167millionduringtheyearendedDecember31,2015whencomparedtothesameperiodin2014,primarily
duetoincreasedSEMcostsandotheronlinetrafficacquisitioncosts,increasedcostsrelatedtoourtelevisioncampaign,andincrementalcostsrelatedtoour2014
businessacquisitionsinAttractionsandRestaurants.DuringtheyearendedDecember31,2015,wespent$51milliononourtelevisionadvertising
campaign.Personnelandoverheadcostsincreased$23millionduringtheyearendedDecember31,2015whencomparedtothesameperiodin2014,primarily
duetoincrementalpersonnelcostsrelatedtoour2014businessacquisitionsinAttractionsandRestaurants.OurAttractionandRestaurantbusinessescontributed
anincremental$68milliontooursellingandmarketingexpensesfortheyearendedDecember31,2015,ofwhichanincremental$20millionwasrelatedto
personnelandoverhead.
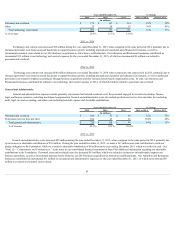
2014 vs. 2013
Directsellingandmarketingcostsincreased$104millionduringtheyearendedDecember31,2014whencomparedtothesameperiodin2013,primarily
duetoincreasedSEMcosts,otheronlinetrafficacquisitioncosts,costsrelatedtoourtelevisioncampaign,inadditiontoincrementalcostsfromourrecentbusiness
acquisitions,partiallyoffsetbyadecreaseinspendinginsocialmediacostsandotherofflineadvertisingcosts,excludingtelevisionadvertising.Wespent$33
milliononourtelevisioncampaignduringtheyearendedDecember31,2014,whichwaslaunchedinMay2014.Personnelandoverheadcostsincreased$30
millionduringtheyearendedDecember31,2014whencomparedtothesameperiodin2013,primarilyduetoanincreaseinheadcounttosupportbusiness
growth,includinginternationalexpansionandemployeesjoiningusthroughrecentbusinessacquisitions,whichalsoincreasedstock-basedcompensationcosts.In
total,ourAttractionandRestaurantbusinessescontributed$25milliontooursellingandmarketingexpensein2014,ofwhich$8millionrelatedtopersonneland
overhead.
Technology and Content
Technologyandcontentexpensesconsistofpersonnelandoverheadexpenses,includingsalariesandbenefits,stock-basedcompensationandbonusesfor
salariedemployeesandcontractorsengagedinthedesign,development,testing,contentsupport,andmaintenanceofourwebsitesandmobileapps.Othercosts
includelicensing,maintenanceexpense,computersupplies,andtechnologyhardware.
40