Thrifty Car Rental 2011 Annual Report Download - page 87
Download and view the complete annual report
Please find page 87 of the 2011 Thrifty Car Rental annual report below. You can navigate through the pages in the report by either clicking on the pages listed below, or by using the keyword search tool below to find specific information within the annual report.-
 1
1 -
2
-
3
-
4
-
5
-
6
-
7
-
8
-
9
-
10
-
11
-
12
-
13
-
14
-
15
-
16
-
17
-
18
-
19
-
20
-
21
-
22
-
23
-
24
-
25
-
26
-
27
-
28
-
29
-
30
-
31
-
32
-
33
-
34
-
35
-
36
-
37
-
38
-
39
-
40
-
41
-
42
-
43
-
44
-
45
-
46
-
47
-
48
-
49
-
50
-
51
-
52
-
53
-
54
-
55
-
56
-
57
-
58
-
59
-
60
-
61
-
62
-
63
-
64
-
65
-
66
-
67
-
68
-
69
-
70
-
71
-
72
-
73
-
74
-
75
-
76
-
 77
77 -
 78
78 -
 79
79 -
 80
80 -
 81
81 -
 82
82 -
 83
83 -
 84
84 -
 85
85 -
 86
86 -
 87
87 -
 88
88 -
 89
89 -
 90
90 -
 91
91 -
 92
92 -
 93
93 -
 94
94 -
 95
95 -
 96
96 -
 97
97 -
98
-
99
-
100
-
101
-
102
-
103
-
104
-
105
-
106
-
107
-
108
-
109
-
110
-
111
-
112
-
113
-
114
-
115
-
116
-
117
-
118
 |
 |

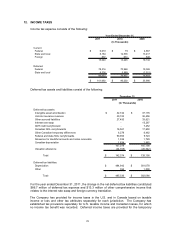
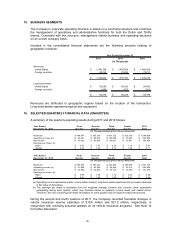
15. BUSINESS SEGMENTS
The Company’s corporate operating structure is based on a functional structure and combines
the management of operations and administrative functions for both the Dollar and Thrifty
brands. Consistent with this structure, management makes business and operating decisions
on an overall company basis.
Included in the consolidated financial statements are the following amounts relating to
geographic locations:
Year Ended December 31,
2011 2010 2009
(In Thousands)
Revenues:
United States 1,466,186$ 1,455,958$ 1,466,508$
Foreign countries 82,742 81,202 79,741
1,548,928$ 1,537,160$ 1,546,249$
Long-lived assets:
United States 82,588$ 88,433$ 94,606$
Foreign countries 1,690 1,795 1,592
84,278$ 90,228$ 96,198$
Revenues are attributed to geographic regions based on the location of the transaction.
Long-lived assets represent property and equipment.
16. SELECTED QUARTERLY FINANCIAL DATA (UNAUDITED)
A summary of the quarterly operating results during 2011 and 2010 follows:
Year Ended First Second Third Fourth 2011
December 31, 2011 Quarter Quarter Quarter Quarter Total
Revenues 348,347$ 395,129$ 451,722$ 353,730$ 1,548,928$
Operating income (a) 46,921$ 88,818$ 126,036$ 73,685$ 335,460$
Net income 16,523$ 42,505$ 66,621$ 33,901$ 159,550$
Earnings per share: (b)
Basic 0.57$ 1.47$ 2.30$ 1.16$ 5.51$
Diluted 0.53$ 1.36$ 2.13$ 1.08$ 5.11$
Year Ended First Second Third Fourth 2010
December 31, 2010 Quarter Quarter Quarter Quarter Total
Revenues 348,330$ 396,227$ 443,544$ 349,059$ 1,537,160$
Operating income (a) 61,088$ 84,436$ 94,246$ 43,314$ 283,084$
Net income 27,292$ 42,263$ 49,165$ 12,496$ 131,216$
Earnings per share: (b)
Basic 0.96$ 1.48$ 1.72$ 0.44$ 4.58$
Diluted 0.91$ 1.40$ 1.62$ 0.41$ 4.34$
(In Thousands Except Per Share Amounts)
(In Thousands Except Per Share Amounts)
(a) Operating income represents pretax income before interest, long-lived asset impairment and (increase) decrease
in fair value of derivatives.
(b) The earnings per share is calculated from the weighted average common and common stock equivalents
outstanding during each quarter, which may fluctuate based on quarterly income levels and market prices.
Therefore, the sum of earnings per share information for each quarter may not equal the total year amounts.
During the second and fourth quarters of 2011, the Company recorded favorable changes in
vehicle insurance reserve estimates of $10.6 million and $21.2 million, respectively, in
conjunction with receiving actuarial updates on its vehicle insurance programs. See Note 14
for further discussion.
85