Thrifty Car Rental 2011 Annual Report Download - page 55
Download and view the complete annual report
Please find page 55 of the 2011 Thrifty Car Rental annual report below. You can navigate through the pages in the report by either clicking on the pages listed below, or by using the keyword search tool below to find specific information within the annual report.-
 1
1 -
2
-
3
-
4
-
5
-
6
-
7
-
8
-
9
-
10
-
11
-
12
-
13
-
14
-
15
-
16
-
17
-
18
-
19
-
20
-
21
-
22
-
23
-
24
-
25
-
26
-
27
-
28
-
29
-
30
-
31
-
32
-
33
-
34
-
35
-
36
-
37
-
38
-
39
-
40
-
41
-
42
-
43
-
44
-
 45
45 -
 46
46 -
 47
47 -
 48
48 -
 49
49 -
 50
50 -
 51
51 -
 52
52 -
 53
53 -
 54
54 -
 55
55 -
 56
56 -
 57
57 -
 58
58 -
 59
59 -
 60
60 -
 61
61 -
 62
62 -
 63
63 -
 64
64 -
 65
65 -
66
-
67
-
68
-
69
-
70
-
71
-
72
-
73
-
74
-
75
-
76
-
77
-
78
-
79
-
80
-
81
-
82
-
83
-
84
-
85
-
86
-
87
-
88
-
89
-
90
-
91
-
92
-
93
-
94
-
95
-
96
-
97
-
98
-
99
-
100
-
101
-
102
-
103
-
104
-
105
-
106
-
107
-
108
-
109
-
110
-
111
-
112
-
113
-
114
-
115
-
116
-
117
-
118
 |
 |

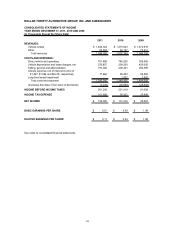
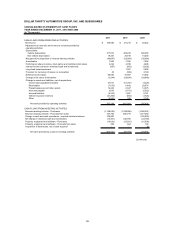
DOLLAR THRIFTY AUTOMOTIVE GROUP, INC. AND SUBSIDIARIES
CONSOLIDATED STATEMENTS OF INCOME
Y
EAR ENDED DECEMBER 31, 2011, 2010 AND 2009
(In Thousands Except Per Share Data)
2011 2010 2009
REVENUES:
Vehicle rentals 1,484,324$ 1,473,023$ 1,472,918$
Other 64,604 64,137 73,331
Total revenues 1,548,928 1,537,160 1,546,249
COSTS AND EXPENSES:
Direct vehicle and operating 751,468 745,535 768,456
Vehicle depreciation and lease charges, net 270,957 299,200 426,092
Selling, general and administrative 191,043 209,341 200,389
Interest expense, net of interest income of
$1,467, $1,584 and $6,218, respectively 77,462 89,303 96,560
Long-lived asset impairment - 1,057 2,592
Total costs and expenses 1,290,930 1,344,436 1,494,089
(Increase) decrease in fair value of derivatives (3,244) (28,694) (28,848)
INCOME BEFORE INCOME TAXES 261,242 221,418 81,008
INCOME TAX EXPENSE 101,692 90,202 35,986
NET INCOME 159,550$ 131,216$ 45,022$
BASIC EARNINGS PER SHARE 5.51$ 4.58$ 1.98$
DILUTED EARNINGS PER SHARE 5.11$ 4.34$ 1.88$
See notes to consolidated financial statements.
53