Thrifty Car Rental 2011 Annual Report Download - page 35
Download and view the complete annual report
Please find page 35 of the 2011 Thrifty Car Rental annual report below. You can navigate through the pages in the report by either clicking on the pages listed below, or by using the keyword search tool below to find specific information within the annual report.-
 1
1 -
2
-
3
-
4
-
5
-
6
-
7
-
8
-
9
-
10
-
11
-
12
-
13
-
14
-
15
-
16
-
17
-
18
-
19
-
20
-
21
-
22
-
23
-
24
-
 25
25 -
 26
26 -
 27
27 -
 28
28 -
 29
29 -
 30
30 -
 31
31 -
 32
32 -
 33
33 -
 34
34 -
 35
35 -
 36
36 -
 37
37 -
 38
38 -
 39
39 -
 40
40 -
 41
41 -
 42
42 -
 43
43 -
 44
44 -
 45
45 -
46
-
47
-
48
-
49
-
50
-
51
-
52
-
53
-
54
-
55
-
56
-
57
-
58
-
59
-
60
-
61
-
62
-
63
-
64
-
65
-
66
-
67
-
68
-
69
-
70
-
71
-
72
-
73
-
74
-
75
-
76
-
77
-
78
-
79
-
80
-
81
-
82
-
83
-
84
-
85
-
86
-
87
-
88
-
89
-
90
-
91
-
92
-
93
-
94
-
95
-
96
-
97
-
98
-
99
-
100
-
101
-
102
-
103
-
104
-
105
-
106
-
107
-
108
-
109
-
110
-
111
-
112
-
113
-
114
-
115
-
116
-
117
-
118
 |
 |

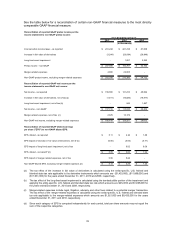
See the table below for a reconciliation of certain non-GAAP financial measures to the most directly
comparable GAAP financial measure.
Reconciliation of reported GAAP pretax income per the
income statement to non-GAAP pretax income:
2011 2010 2009
(in thousands)
Income before income taxes - as reported 261,242$ 221,418$ 81,008$
Increase in fair value of derivatives (3,244) (28,694) (28,848)
Long-lived asset impairment - 1,057 2,592
Pretax income - non-GAAP 257,998$ 193,781$ 54,752$
Merger-related expenses 4,600 22,605 -
Non-GAAP pretax income, excluding merger-related expenses 262,598$ 216,386$ 54,752$
Reconciliation of reported GAAP net income per the
income statement to non-GAAP net income:
Net income - as reported 159,550$ 131,216$ 45,022$
Increase in fair value of derivatives, net of tax (a) (1,811) (16,826) (16,917)
Long-lived asset impairment, net of tax (b) - 645 1,497
Net income - non-GAAP 157,739$ 115,035$ 29,602$
Merger-related expenses, net of tax (c) 2,679 13,172 -
Non-GAAP net income, excluding merger-related expenses 160,418$ 128,207$ 29,602$
Reconciliation of reported GAAP diluted earnings
per share ("EPS") to non-GAAP diluted EPS:
EPS, diluted - as reported 5.11$ 4.34$ 1.88$
EPS impact of increase in fair value of derivatives, net of tax (0.06) (0.56) (0.71)
EPS impact of long-lived asset impairment, net of tax - 0.02 0.06
EPS, diluted - non-GAAP (d) 5.05$ 3.80$ 1.24$
EPS impact of merger-related expenses, net of tax 0.09 0.44 -
Non-GAAP diluted EPS, excluding merger-related expenses (d) 5.13$ 4.24$ 1.24$
Year Ended December 31,
(a) The tax effect of the increase in fair value of derivatives is calculated using the entity-specific, U.S. federal and
blended state tax rate applicable to the derivative instruments which amounts are ($1,433,000), ($11,868,000) and
($11,931,000) for the years ended December 31, 2011, 2010 and 2009, respectively.
(b) The tax effect of the long-lived asset impairment is calculated using the tax-deductible portion of the impairment and
applying the entity-specific, U.S. federal and blended state tax rate which amounts are $412,000 and $1,095,000 for
the years ended December 31, 2010 and 2009, respectively.
(c) Merger-related expenses include legal, litigation, advisory and other fees related to a potential merger transaction.
The tax effect of the merger-related expenses is calculated using the entity-specific, U.S. federal and blended state
tax rate applicable to the merger-related expenses which amounts are $1,921,000 and $9,433,000 for the years
ended December 31, 2011 and 2010, respectively.
(d) Since each category of EPS is computed independently for each period, total per share amounts may not equal the
sum of the respective categories.
33