Thrifty Car Rental 2011 Annual Report Download - page 32
Download and view the complete annual report
Please find page 32 of the 2011 Thrifty Car Rental annual report below. You can navigate through the pages in the report by either clicking on the pages listed below, or by using the keyword search tool below to find specific information within the annual report.-
 1
1 -
2
-
3
-
4
-
5
-
6
-
7
-
8
-
9
-
10
-
11
-
12
-
13
-
14
-
15
-
16
-
17
-
18
-
19
-
20
-
21
-
 22
22 -
 23
23 -
 24
24 -
 25
25 -
 26
26 -
 27
27 -
 28
28 -
 29
29 -
 30
30 -
 31
31 -
 32
32 -
 33
33 -
 34
34 -
 35
35 -
 36
36 -
 37
37 -
 38
38 -
 39
39 -
 40
40 -
 41
41 -
 42
42 -
43
-
44
-
45
-
46
-
47
-
48
-
49
-
50
-
51
-
52
-
53
-
54
-
55
-
56
-
57
-
58
-
59
-
60
-
61
-
62
-
63
-
64
-
65
-
66
-
67
-
68
-
69
-
70
-
71
-
72
-
73
-
74
-
75
-
76
-
77
-
78
-
79
-
80
-
81
-
82
-
83
-
84
-
85
-
86
-
87
-
88
-
89
-
90
-
91
-
92
-
93
-
94
-
95
-
96
-
97
-
98
-
99
-
100
-
101
-
102
-
103
-
104
-
105
-
106
-
107
-
108
-
109
-
110
-
111
-
112
-
113
-
114
-
115
-
116
-
117
-
118
 |
 |
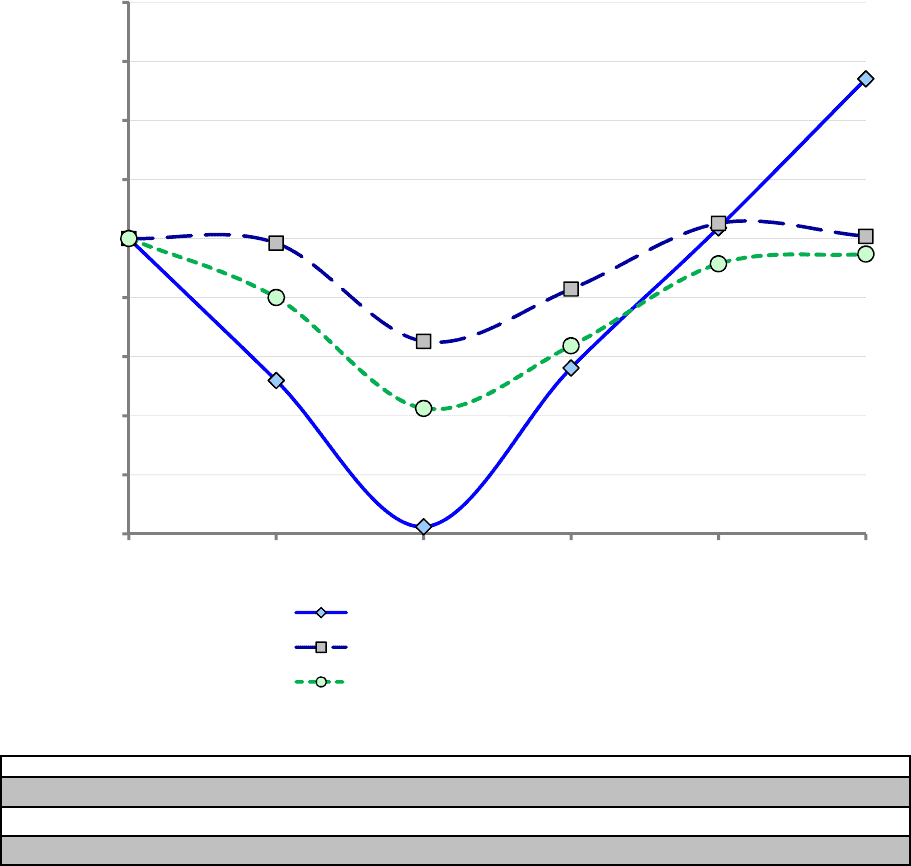
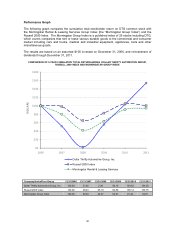
Performance Graph
The following graph compares the cumulative total stockholder return on DTG common stock with
the Morningstar Rental & Leasing Services Group Index (the “Morningstar Group Index”) and the
Russell 2000 Index. The Morningstar Group Index is a published index of 25 stocks including DTG,
which covers companies that rent or lease various durable goods to the commercial and consumer
market including cars and trucks, medical and industrial equipment, appliances, tools and other
miscellaneous goods.
The results are based on an assumed $100 invested on December 31, 2006, and reinvestment of
dividends through December 31, 2011.
$0
$20
$40
$60
$80
$100
$120
$140
$160
$180
2006 2007 2008 2009 2010 2011
Dollar Thrifty Automotive Group, Inc.
Russell 2000 Index
Morningstar Rental & Leasing Services
DOLLARS
COMPARISON OF 5-YEAR CUMULATIVE TOTAL RETURN AMONG DOLLAR THRIFTY AUTOMOTIVE GROUP,
RUSSELL 2000 INDEX AND MORNINGSTAR GROUP INDEX
Company/Index/Peer Group 12/31/2006 12/31/2007 12/31/2008 12/31/2009 12/31/2010 12/31/2011
Dollar Thrifty Automotive Group, Inc. 100.00 51.92 2.39 56.15 103.62 154.05
Russell 2000 Index 100.00 98.43 65.18 82.89 105.14 100.75
Morningstar Group Index 100.00 80.04 42.47 63.67 91.44 94.75
30