Thrifty Car Rental 2011 Annual Report Download - page 40
Download and view the complete annual report
Please find page 40 of the 2011 Thrifty Car Rental annual report below. You can navigate through the pages in the report by either clicking on the pages listed below, or by using the keyword search tool below to find specific information within the annual report.-
 1
1 -
2
-
3
-
4
-
5
-
6
-
7
-
8
-
9
-
10
-
11
-
12
-
13
-
14
-
15
-
16
-
17
-
18
-
19
-
20
-
21
-
22
-
23
-
24
-
25
-
26
-
27
-
28
-
29
-
 30
30 -
 31
31 -
 32
32 -
 33
33 -
 34
34 -
 35
35 -
 36
36 -
 37
37 -
 38
38 -
 39
39 -
 40
40 -
 41
41 -
 42
42 -
 43
43 -
 44
44 -
 45
45 -
 46
46 -
 47
47 -
 48
48 -
 49
49 -
 50
50 -
51
-
52
-
53
-
54
-
55
-
56
-
57
-
58
-
59
-
60
-
61
-
62
-
63
-
64
-
65
-
66
-
67
-
68
-
69
-
70
-
71
-
72
-
73
-
74
-
75
-
76
-
77
-
78
-
79
-
80
-
81
-
82
-
83
-
84
-
85
-
86
-
87
-
88
-
89
-
90
-
91
-
92
-
93
-
94
-
95
-
96
-
97
-
98
-
99
-
100
-
101
-
102
-
103
-
104
-
105
-
106
-
107
-
108
-
109
-
110
-
111
-
112
-
113
-
114
-
115
-
116
-
117
-
118
 |
 |
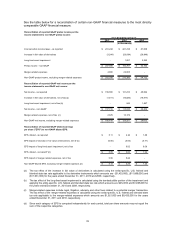
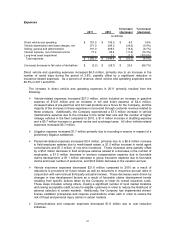
Net vehicle depreciation and lease charges decreased $28.2 million. As a percent of revenue, net
vehicle depreciation expense and lease charges were 17.5% in 2011, compared to 19.5% in 2010.
The decrease in net vehicle depreciation and lease charges resulted from the following:
Vehicle depreciation expense decreased $44.4 million, primarily resulting from a 16.1%
decrease in the average depreciation rate due to continued favorable used vehicle market
conditions, partially offset by a 4.8% increase in the average depreciable fleet.
Net vehicle gains on disposal of risk vehicles (reductions to net vehicle depreciation and
lease charges), which effectively represent revisions to previous estimates of vehicle
depreciation charges by reducing vehicle depreciation and lease charges, decreased $16.2
million from a $63.1 million gain in 2010 to a $46.9 million gain in 2011. This decrease in
gains on vehicle dispositions resulted from approximately 17,700 fewer units sold in 2011,
partially offset by a higher average gain per unit in 2011 as compared to 2010.
Selling, general and administrative expenses for 2011 decreased $18.3 million. As a percent of
revenue, selling, general and administrative expenses were 12.3% in 2011, compared to 13.6% in
2010.
The decrease in selling, general and administrative expenses in 2011 primarily resulted from the
following:
Merger-related costs decreased $18.0 million.
Outsourcing expenses decreased $1.4 million primarily due to a lower base fee paid to a
third party service provider in 2011 as compared to 2010.
Loyalty programs and commission expenses increased $1.4 million primarily due to
increased rental days.
Net interest expense decreased $11.9 million in 2011 primarily due to lower average vehicle debt
and lower interest rates, partially offset by higher amortization of deferred financing costs and a $2.7
million write-off of deferred financing fees related to the payoff of the Term Loan (hereinafter defined)
and termination of the Series 2010-1 notes. As a percent of revenue, net interest expense was 5.0%
in 2011, compared to 5.8% in 2010.
Long-lived asset impairment expense decreased $1.1 million in 2011, due to write-offs of software no
longer in use during 2010 with no corresponding write-offs in 2011.
The change in fair value of the Company’s derivative agreements was an increase of $3.2 million in
2011 compared to an increase of $28.7 million in 2010, primarily due to the decrease in the amount
of outstanding derivative agreements not designated as hedging instruments, as well as market
changes in the interest rate yield curve and a reduction in the remaining term to maturity of the
derivative agreements.
Income tax expense for 2011 was $101.7 million, compared to $90.2 million for 2010. The Company
reports taxable income for the U.S. and Canada in separate tax jurisdictions and establishes
provisions separately for each jurisdiction. On a separate, domestic basis, the U.S. effective tax rate
approximates the statutory tax rate including the effect of state income taxes. The Company’s
overall effective tax rate will vary depending on the amount of taxable income generated by the
Company’s operations in various states and the applicable tax rates in those states, as well as the
proportion those taxes represent of the Company’s pretax income on a consolidated basis. The
effective income tax rates for 2011 of 38.9% and 2010 of 40.7% were higher than the statutory rates
principally due to state and local income taxes. The decrease in state income tax rate was
attributable to variations in the overall apportionment of income among states.
38