Thrifty Car Rental 2011 Annual Report Download - page 33
Download and view the complete annual report
Please find page 33 of the 2011 Thrifty Car Rental annual report below. You can navigate through the pages in the report by either clicking on the pages listed below, or by using the keyword search tool below to find specific information within the annual report.-
 1
1 -
2
-
3
-
4
-
5
-
6
-
7
-
8
-
9
-
10
-
11
-
12
-
13
-
14
-
15
-
16
-
17
-
18
-
19
-
20
-
21
-
22
-
 23
23 -
 24
24 -
 25
25 -
 26
26 -
 27
27 -
 28
28 -
 29
29 -
 30
30 -
 31
31 -
 32
32 -
 33
33 -
 34
34 -
 35
35 -
 36
36 -
 37
37 -
 38
38 -
 39
39 -
 40
40 -
 41
41 -
 42
42 -
 43
43 -
44
-
45
-
46
-
47
-
48
-
49
-
50
-
51
-
52
-
53
-
54
-
55
-
56
-
57
-
58
-
59
-
60
-
61
-
62
-
63
-
64
-
65
-
66
-
67
-
68
-
69
-
70
-
71
-
72
-
73
-
74
-
75
-
76
-
77
-
78
-
79
-
80
-
81
-
82
-
83
-
84
-
85
-
86
-
87
-
88
-
89
-
90
-
91
-
92
-
93
-
94
-
95
-
96
-
97
-
98
-
99
-
100
-
101
-
102
-
103
-
104
-
105
-
106
-
107
-
108
-
109
-
110
-
111
-
112
-
113
-
114
-
115
-
116
-
117
-
118
 |
 |

ITEM 6. SELECTED FINANCIAL DATA
The selected consolidated financial data was derived from the audited consolidated financial
statements of the Company. The system-wide data and company-owned stores data were derived
from Company records.
2011 2010 2009 2008 2007
Statements of Operations:
Revenues:
Vehicle rentals 1,484,324$ 1,473,023$ 1,472,918$ 1,616,153$ 1,676,349$
Other 64,604 64,137 73,331 81,840 84,442
Total revenues 1,548,928 1,537,160 1,546,249 1,697,993 1,760,791
Costs and expenses:
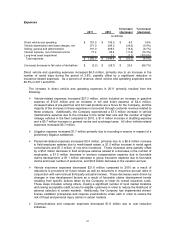
Direct vehicle and operating 751,468 745,535 768,456 888,294 887,178
Vehicle depreciation and lease
charges, net 270,957 299,200 426,092 539,406 477,853
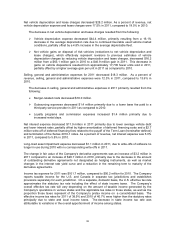
Selling, general and
administrative 191,043 209,341 200,389 213,734 230,515
Interest expense, net 77,462 89,303 96,560 110,424 109,728
Goodwill and long-lived asset impairment - 1,057 2,592 366,822 3,719
Total costs and expenses 1,290,930 1,344,436 1,494,089 2,118,680 1,708,993
(Increase) decrease in fair value of derivatives (3,244) (28,694) (28,848) 36,114 38,990
Income (loss) before income taxes 261,242 221,418 81,008 (456,801) 12,808
Income tax expense (benefit) 101,692 90,202 35,986 (110,083) 11,593
Net income (loss) 159,550$ 131,216$ 45,022$ (346,718)$ 1,215$
Basic Earnings (Loss) Per Share 5.51$ 4.58$ 1.98$ (16.22)$ 0.05$
Diluted Earnings (Loss) Per Share 5.11$ 4.34$ 1.88$ (16.22)$ 0.05$
Balance Sheet Data:
Cash and cash equivalents 508,648$ 463,153$ 400,404$ 229,636$ 101,025$
Cash and cash equivalents - required minimum balance -$ 100,000$ 100,000$ -$ -$
Restricted cash and investments 353,265$ 277,407$ 622,540$ 596,588$ 132,945$
Revenue-earning vehicles, net 1,467,835$ 1,341,822$ 1,228,637$ 1,946,079$ 2,808,354$
Total assets 2,615,666$ 2,499,528$ 2,645,937$ 3,238,181$ 3,891,452$
Debt and other obligations 1,399,955$ 1,397,243$ 1,727,810$ 2,488,245$ 2,656,562$
Stockholders' equity 607,672$ 538,607$ 393,914$ 208,420$ 578,865$
Year Ended December 31,
(in thousands except per share amounts)
U. S. and Canada
2011 2010 2009 2008 2007
System-wide Data:
Rental locations:
Company-owned stores 280 297 296 400 466
Franchisee locations 306 308 317 341 365
Total rental locations 586 605 613 741 831
Company-owned Stores Data:
V
ehicle rental data:
Average number of vehicles operated 107,154 102,291 102,948 120,309 123,484
Number of rental days 31,482,339 30,338,815 30,616,395 36,879,641 37,231,340
Vehicle utilization 80.5% 81.3% 81.5% 83.8% 82.6%
Average revenue per day 47.15$ 48.55$ 48.11$ 43.82$ 45.03$
Monthly average revenue per vehicle 1,154$ 1,200$ 1,192$ 1,119$ 1,131$
Average depreciable fleet 108,127 103,207 105,301 123,673 127,979
Monthly average depreciation
(net) per vehicle 209$ 242$ 337$ 363$ 311$
Year Ended December 31,
31