Thrifty Car Rental 2011 Annual Report Download - page 68
Download and view the complete annual report
Please find page 68 of the 2011 Thrifty Car Rental annual report below. You can navigate through the pages in the report by either clicking on the pages listed below, or by using the keyword search tool below to find specific information within the annual report.-
 1
1 -
2
-
3
-
4
-
5
-
6
-
7
-
8
-
9
-
10
-
11
-
12
-
13
-
14
-
15
-
16
-
17
-
18
-
19
-
20
-
21
-
22
-
23
-
24
-
25
-
26
-
27
-
28
-
29
-
30
-
31
-
32
-
33
-
34
-
35
-
36
-
37
-
38
-
39
-
40
-
41
-
42
-
43
-
44
-
45
-
46
-
47
-
48
-
49
-
50
-
51
-
52
-
53
-
54
-
55
-
56
-
57
-
 58
58 -
 59
59 -
 60
60 -
 61
61 -
 62
62 -
 63
63 -
 64
64 -
 65
65 -
 66
66 -
 67
67 -
 68
68 -
 69
69 -
 70
70 -
 71
71 -
 72
72 -
 73
73 -
 74
74 -
 75
75 -
 76
76 -
 77
77 -
 78
78 -
79
-
80
-
81
-
82
-
83
-
84
-
85
-
86
-
87
-
88
-
89
-
90
-
91
-
92
-
93
-
94
-
95
-
96
-
97
-
98
-
99
-
100
-
101
-
102
-
103
-
104
-
105
-
106
-
107
-
108
-
109
-
110
-
111
-
112
-
113
-
114
-
115
-
116
-
117
-
118
 |
 |

periodically adjusted on a prospective basis when residual value assumptions change due to
changes in used vehicle market conditions.
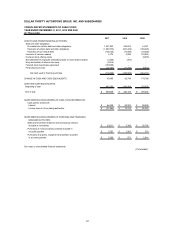
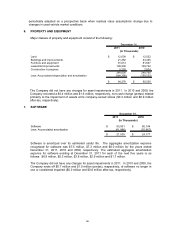
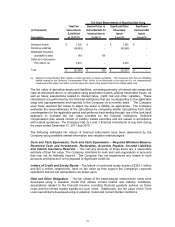
6. PROPERTY AND EQUIPMENT
Major classes of property and equipment consist of the following:
2011 2010
Land 12,009$ 12,022$
Buildings and improvements 21,382 23,325
Furniture and equipment 81,014 81,847
Leasehold improvements 128,938 128,742
Construction in progress 5,293 2,824
248,636 248,760
Less: Accumulated depreciation and amortization (164,358) (158,532)
84,278
$
90,228
$
December 31,
(In Thousands)
The Company did not have any charges for asset impairments in 2011. In 2010 and 2009, the
Company recorded a $0.4 million and $1.6 million, respectively, non-cash charge (pretax) related
primarily to the impairment of assets at its company-owned stores ($0.3 million and $0.9 million
after-tax, respectively).
7. SOFTWARE
2011 2010
Software 83,501$ 80,144$
Less: Accumulated amortization (61,966) (55,967)
21,535$ 24,177$
December 31,
(In Thousands)
Software is amortized over its estimated useful life. The aggregate amortization expense
recognized for software was $7.5 million, $7.3 million and $8.0 million for the years ended
December 31, 2011, 2010 and 2009, respectively. The estimated aggregate amortization
expense for software existing at December 31, 2011 for each of the next five years is as
follows: $6.9 million, $5.3 million, $3.8 million, $2.9 million and $1.7 million.
The Company did not have any charges for asset impairments in 2011. In 2010 and 2009, the
Company wrote off $0.7 million and $1.0 million (pretax), respectively, of software no longer in
use or considered impaired ($0.3 million and $0.6 million after-tax, respectively).
66