Thrifty Car Rental 2011 Annual Report Download - page 84
Download and view the complete annual report
Please find page 84 of the 2011 Thrifty Car Rental annual report below. You can navigate through the pages in the report by either clicking on the pages listed below, or by using the keyword search tool below to find specific information within the annual report.-
 1
1 -
2
-
3
-
4
-
5
-
6
-
7
-
8
-
9
-
10
-
11
-
12
-
13
-
14
-
15
-
16
-
17
-
18
-
19
-
20
-
21
-
22
-
23
-
24
-
25
-
26
-
27
-
28
-
29
-
30
-
31
-
32
-
33
-
34
-
35
-
36
-
37
-
38
-
39
-
40
-
41
-
42
-
43
-
44
-
45
-
46
-
47
-
48
-
49
-
50
-
51
-
52
-
53
-
54
-
55
-
56
-
57
-
58
-
59
-
60
-
61
-
62
-
63
-
64
-
65
-
66
-
67
-
68
-
69
-
70
-
71
-
72
-
73
-
 74
74 -
 75
75 -
 76
76 -
 77
77 -
 78
78 -
 79
79 -
 80
80 -
 81
81 -
 82
82 -
 83
83 -
 84
84 -
 85
85 -
 86
86 -
 87
87 -
 88
88 -
 89
89 -
 90
90 -
 91
91 -
 92
92 -
 93
93 -
 94
94 -
95
-
96
-
97
-
98
-
99
-
100
-
101
-
102
-
103
-
104
-
105
-
106
-
107
-
108
-
109
-
110
-
111
-
112
-
113
-
114
-
115
-
116
-
117
-
118
 |
 |

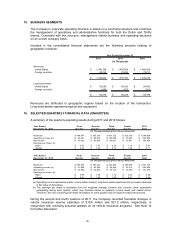
The Company’s subsidiaries operate from various leased premises under operating leases with
terms up to 30 years. Some of the leases contain renewal options. Certain leases include
contingent rental amount based on a percentage of the Company’s revenue or gross receipts
as defined in the lease agreement.
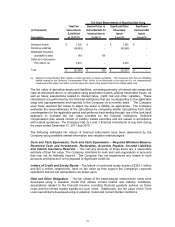
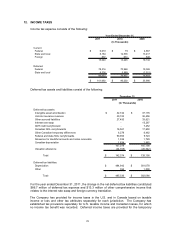
Expenses incurred under operating leases and concessions were as follows:
Year Ended December 31,
2011 2010 2009
(In Thousands)
Rent 48,682$ 47,915$ 49,543$
Concession expenses:
Minimum fees 107,095 102,080 101,938
Contingent fees 27,144 31,711 32,263
182,921 181,706 183,744
Less sublease rental income (498) (574) (785)
Total 182,423$ 181,132$ 182,959$
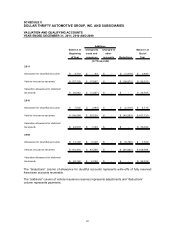
Future minimum rentals and fees under noncancelable operating leases and the Company’s
obligations for minimum airport concession fees at December 31, 2011 are presented in the
following table:
Company-Owned
Stores Operating
Concession Fees Leases Total
(In Thousands)
2012 98,351$ 40,429$ 138,780$
2013 85,594 32,866 118,460
2014 62,120 25,323 87,443
2015 43,908 20,221 64,129
2016 37,088 17,290 54,378
Thereafter 130,771 48,333 179,104
457,832 184,462 642,294
Less sublease rental income - (895) (895)
457,832$ 183,567$ 641,399$
Vehicle Insurance Reserves
The Company is self insured for a portion of vehicle insurance claims. In 2011, 2010 and 2009,
the Company retained risk of loss up to $7.5 million, in each year, per occurrence for public
liability and property damage claims, including third-party bodily injury and property damage.
The Company maintains insurance for losses above these levels. The Company retains the
risk of loss on SLI policies sold to vehicle rental customers.
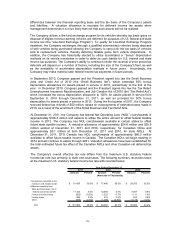
The Company records reserves for its public liability and property damage exposure using
actuarially-based loss estimates, which are updated semi-annually in June and December of
each year. In June 2011, the Company began semi-annual updates for SLI, as such reserves
had been previously updated on an annual basis in December. As a result of favorable overall
claims loss development experienced in 2011 and 2010, the Company recorded favorable
insurance reserve adjustments, which effectively represents revision to previous estimates of
vehicle insurance charges, of $32.2 million and $13.4 million during 2011 and 2010,
respectively. This favorable claims development is driven by changes in loss development
factors as a result of favorable claims development trends resulting from specific actions taken
by the Company to lower its overall insurance costs. Those steps included, among others,
closing a significant number of local market locations and raising acceptable credit scores for
82