Thrifty Car Rental 2011 Annual Report Download - page 37
Download and view the complete annual report
Please find page 37 of the 2011 Thrifty Car Rental annual report below. You can navigate through the pages in the report by either clicking on the pages listed below, or by using the keyword search tool below to find specific information within the annual report.-
 1
1 -
2
-
3
-
4
-
5
-
6
-
7
-
8
-
9
-
10
-
11
-
12
-
13
-
14
-
15
-
16
-
17
-
18
-
19
-
20
-
21
-
22
-
23
-
24
-
25
-
26
-
 27
27 -
 28
28 -
 29
29 -
 30
30 -
 31
31 -
 32
32 -
 33
33 -
 34
34 -
 35
35 -
 36
36 -
 37
37 -
 38
38 -
 39
39 -
 40
40 -
 41
41 -
 42
42 -
 43
43 -
 44
44 -
 45
45 -
 46
46 -
 47
47 -
48
-
49
-
50
-
51
-
52
-
53
-
54
-
55
-
56
-
57
-
58
-
59
-
60
-
61
-
62
-
63
-
64
-
65
-
66
-
67
-
68
-
69
-
70
-
71
-
72
-
73
-
74
-
75
-
76
-
77
-
78
-
79
-
80
-
81
-
82
-
83
-
84
-
85
-
86
-
87
-
88
-
89
-
90
-
91
-
92
-
93
-
94
-
95
-
96
-
97
-
98
-
99
-
100
-
101
-
102
-
103
-
104
-
105
-
106
-
107
-
108
-
109
-
110
-
111
-
112
-
113
-
114
-
115
-
116
-
117
-
118
 |
 |

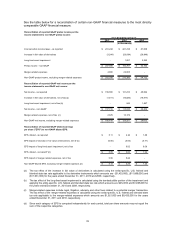
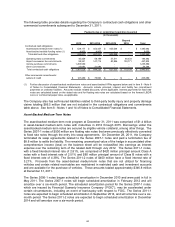
The Company’s operating performance is significantly impacted by increases or decreases in certain
key drivers. The table below provides sensitivity to the Company’s results for changes in these key
drivers:
Estimated
Change in Estimated
Corporate Change
Metric Sensitivity
A
djusted EBITD
A
in EPS
(increase or decrease) (increase or decrease)
Revenue Per Day ("RPD") (a)
$1.00 Change in Price
/ RPD 26,000,000$ 0.52$
Rental Days (a) (b)
1% Change in Rental
Days 4,400,000$ 0.09$
Fleet Costs (c)
$10.00 Change in
Fleet Cost Per Vehicle
Per Month 12,000,000$ 0.24$
Operating Expenses (d)
1% Change in
Operating Expense
Ratio (e) 15,000,000$ 0.30$
Note: All scenarios are on a full year basis and assume an effective consolidated tax rate of 39% and 31.0 million diluted
shares.
(a) Assumes 31 million rental days.
(b) Assumes full year revenue per day of $47.15.
(c) Assumes an average fleet of 100,000 vehicles.
(d) Comprised of direct vehicle and operating and selling, general and administrative expenses.
(e) The ratio is derived by dividing operating expenses by total revenue, assuming consolidated total revenue of $1.5
billion.
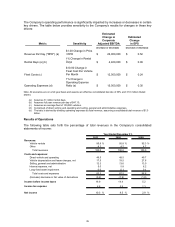
Results of Operations
The following table sets forth the percentage of total revenues in the Company’s consolidated
statements of income:
Revenues:
Vehicle rentals 95.8 % 95.8 % 95.3 %
Other 4.2 4.2 4.7
Total revenues 100.0 100.0 100.0
Costs and expenses:
Direct vehicle and operating 48.5 48.5 49.7
Vehicle depreciation and lease charges, net 17.5 19.5 27.6
Selling, general and administrative 12.3 13.6 13.0
Interest expense, net 5.0 5.8 6.2
Long-lived asset impairment 0.0 0.1 0.1
Total costs and expenses 83.3 87.5 96.6
(Increase) decrease in fair value of derivatives (0.2) (1.9) (1.8)
Income before income taxes 16.9 14.4 5.2
Income tax expense 6.6 5.9 2.3
Net income 10.3% 8.5% 2.9%
Year Ended December 31,
2011 2010 2009
35