Thrifty Car Rental 2011 Annual Report Download - page 43
Download and view the complete annual report
Please find page 43 of the 2011 Thrifty Car Rental annual report below. You can navigate through the pages in the report by either clicking on the pages listed below, or by using the keyword search tool below to find specific information within the annual report.-
 1
1 -
2
-
3
-
4
-
5
-
6
-
7
-
8
-
9
-
10
-
11
-
12
-
13
-
14
-
15
-
16
-
17
-
18
-
19
-
20
-
21
-
22
-
23
-
24
-
25
-
26
-
27
-
28
-
29
-
30
-
31
-
32
-
 33
33 -
 34
34 -
 35
35 -
 36
36 -
 37
37 -
 38
38 -
 39
39 -
 40
40 -
 41
41 -
 42
42 -
 43
43 -
 44
44 -
 45
45 -
 46
46 -
 47
47 -
 48
48 -
 49
49 -
 50
50 -
 51
51 -
 52
52 -
 53
53 -
54
-
55
-
56
-
57
-
58
-
59
-
60
-
61
-
62
-
63
-
64
-
65
-
66
-
67
-
68
-
69
-
70
-
71
-
72
-
73
-
74
-
75
-
76
-
77
-
78
-
79
-
80
-
81
-
82
-
83
-
84
-
85
-
86
-
87
-
88
-
89
-
90
-
91
-
92
-
93
-
94
-
95
-
96
-
97
-
98
-
99
-
100
-
101
-
102
-
103
-
104
-
105
-
106
-
107
-
108
-
109
-
110
-
111
-
112
-
113
-
114
-
115
-
116
-
117
-
118
 |
 |
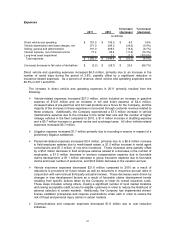
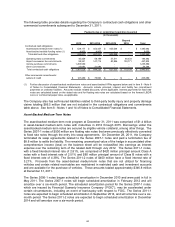
Selling, general and administrative expenses for 2010 increased $9.0 million. As a percent of
revenue, selling, general and administrative expenses were 13.6% in 2010, compared to 13.0% in
2009.
The increase in selling, general and administrative expenses in 2010 resulted from the following:
Merger-related costs incurred in 2010 totaled $22.6 million.
Outsourcing expenses decreased $6.2 million due primarily to a lower fee attributable to
fewer IT-related projects and to a greater number of capitalizable projects in 2010 as
compared to 2009.
Outside services expense decreased $3.6 million primarily due to reduced consulting
expense.
The change in the market value of investments in the Company’s deferred compensation
and retirement plans decreased selling, general and administrative expenses by $1.8 million
in 2010 compared to 2009, which was offset by a corresponding gain on those investments
that is recognized in other revenue and, therefore, did not impact net income.
Sales and marketing expense decreased $0.7 million due primarily to a decrease in print
media, marketing programs tied to transaction levels and reduced promotional advertising
expenses.
All other selling, general and administrative expenses decreased by $1.3 million.
Net interest expense decreased $7.3 million in 2010 primarily due to lower average vehicle debt,
partially offset by reduced interest income as the Company used excess restricted cash on hand to
reduce indebtedness, and to reinvest in the rental fleet. As a percent of revenue, net interest
expense was 5.8% in 2010, compared to 6.2% in 2009.
Long-lived asset impairment expense decreased $1.5 million in 2010 compared to 2009, due to
lower write-offs of long-lived assets at its company-owned stores and software no longer in use.
The change in fair value of the Company’s derivative agreements was an increase of $28.7 million in
2010 compared to an increase of $28.8 million in 2009, due to market changes in the interest rate
yield curve and shorter time to maturity of the derivative agreements.
The income tax expense for 2010 was $90.2 million. The Company reports taxable income for the
U.S. and Canada in separate tax jurisdictions and establishes provisions separately for each
jurisdiction. On a separate, domestic basis, the U.S. effective tax rate approximates the statutory tax
rate including the effect of state income taxes. Our overall effective tax rate will vary depending on
the amount of taxable income generated by our operations in various states and the applicable tax
rates in those states, as well as the proportion those taxes represent of our pretax income on a
consolidated basis. Based on the significant improvement in the Company’s consolidated pretax
income from 2009 to 2010, the impact of state income taxes resulted in a decline in the overall
consolidated effective tax rate from 44.4% to 40.7%.
Operating Results
The Company had income before income taxes of $221.4 million in 2010 compared to income before
income taxes of $81.0 million in 2009.
Liquidity and Capital Resources
The Company’s primary uses of liquidity are for the purchase of vehicles for its rental fleet, including
required collateral enhancement under its fleet financing structures, non-vehicle capital expenditures
41