Thrifty Car Rental 2011 Annual Report Download - page 75
Download and view the complete annual report
Please find page 75 of the 2011 Thrifty Car Rental annual report below. You can navigate through the pages in the report by either clicking on the pages listed below, or by using the keyword search tool below to find specific information within the annual report.-
 1
1 -
2
-
3
-
4
-
5
-
6
-
7
-
8
-
9
-
10
-
11
-
12
-
13
-
14
-
15
-
16
-
17
-
18
-
19
-
20
-
21
-
22
-
23
-
24
-
25
-
26
-
27
-
28
-
29
-
30
-
31
-
32
-
33
-
34
-
35
-
36
-
37
-
38
-
39
-
40
-
41
-
42
-
43
-
44
-
45
-
46
-
47
-
48
-
49
-
50
-
51
-
52
-
53
-
54
-
55
-
56
-
57
-
58
-
59
-
60
-
61
-
62
-
63
-
64
-
 65
65 -
 66
66 -
 67
67 -
 68
68 -
 69
69 -
 70
70 -
 71
71 -
 72
72 -
 73
73 -
 74
74 -
 75
75 -
 76
76 -
 77
77 -
 78
78 -
 79
79 -
 80
80 -
 81
81 -
 82
82 -
 83
83 -
 84
84 -
 85
85 -
86
-
87
-
88
-
89
-
90
-
91
-
92
-
93
-
94
-
95
-
96
-
97
-
98
-
99
-
100
-
101
-
102
-
103
-
104
-
105
-
106
-
107
-
108
-
109
-
110
-
111
-
112
-
113
-
114
-
115
-
116
-
117
-
118
 |
 |

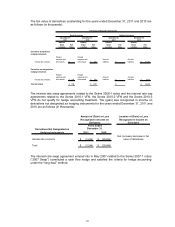
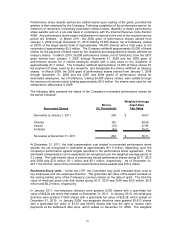
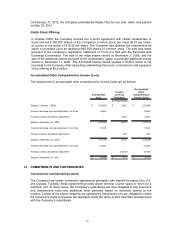
The following tables provide information about the Company’s market sensitive financial
instruments valued at December 31, 2011 and 2010:
Debt and other obligations Carrying Fair Value
at December 31, 2011 Value at 12/31/11
(in thousands)
Debt:
Vehicle debt and obligations-floating rates 500,000$ 495,820$
Vehicle debt and obligations-fixed rates 900,000$ 899,292$
Debt and other obligations Carrying Fair Value
at December 31, 2010 Value at 12/31/10
(in thousands)
Debt:
Vehicle debt and obligations-floating rates (1) 1,200,000$ 1,178,875$
Vehicle debt and obligations-Canadian dollar denominated 49,118$ 49,118$
Non-vehicle debt - Term Loan 148,125$ 146,459$
(1) Includes $500 million relating to the Series 2006-1 notes, the $500 million Series 2007-1 notes swapped from
floating interest rates to fixed interest rates, and the $200 million Series 2010-1 VFN. The fair value excludes
the impact of the related interest rate swaps and cap.
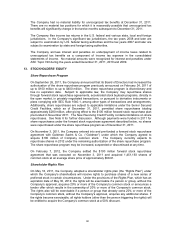
11. EMPLOYEE BENEFIT PLANS INCLUDING SHARE-BASED PAYMENT PLANS
Employee Benefit Plans
The Company sponsors a retirement savings plan that incorporates the salary reduction
provisions of Section 401(k) of the Internal Revenue Code and covers substantially all
employees of the Company meeting specific age and length of service requirements. The
Company matches employee contributions up to 2% of the employee’s eligible compensation in
cash, subject to statutory limitations.
Contributions expensed by the Company totaled $1.8 million, $1.7 million and $1.8 million in
2011, 2010 and 2009, respectively.
Included in accrued liabilities at December 31, 2011 and 2010 is $2.3 million and $2.0 million,
respectively, for employee health claims which are self-insured by the Company. The accrual
includes amounts for incurred and incurred but not reported claims. The Company expensed
$15.4 million, $15.8 million, and $20.2 million for self-insured health claims incurred in 2011,
2010 and 2009, respectively.
The Company has bonus plans for its executive and middle management based on Company
performance. Expense related to these plans was $9.8 million, $11.2 million and $10.0 million
in 2011, 2010 and 2009, respectively.
73