Thrifty Car Rental 2011 Annual Report Download - page 57
Download and view the complete annual report
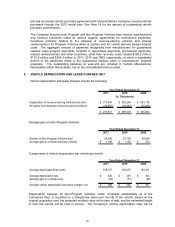
Please find page 57 of the 2011 Thrifty Car Rental annual report below. You can navigate through the pages in the report by either clicking on the pages listed below, or by using the keyword search tool below to find specific information within the annual report.-
 1
1 -
2
-
3
-
4
-
5
-
6
-
7
-
8
-
9
-
10
-
11
-
12
-
13
-
14
-
15
-
16
-
17
-
18
-
19
-
20
-
21
-
22
-
23
-
24
-
25
-
26
-
27
-
28
-
29
-
30
-
31
-
32
-
33
-
34
-
35
-
36
-
37
-
38
-
39
-
40
-
41
-
42
-
43
-
44
-
45
-
46
-
 47
47 -
 48
48 -
 49
49 -
 50
50 -
 51
51 -
 52
52 -
 53
53 -
 54
54 -
 55
55 -
 56
56 -
 57
57 -
 58
58 -
 59
59 -
 60
60 -
 61
61 -
 62
62 -
 63
63 -
 64
64 -
 65
65 -
 66
66 -
 67
67 -
68
-
69
-
70
-
71
-
72
-
73
-
74
-
75
-
76
-
77
-
78
-
79
-
80
-
81
-
82
-
83
-
84
-
85
-
86
-
87
-
88
-
89
-
90
-
91
-
92
-
93
-
94
-
95
-
96
-
97
-
98
-
99
-
100
-
101
-
102
-
103
-
104
-
105
-
106
-
107
-
108
-
109
-
110
-
111
-
112
-
113
-
114
-
115
-
116
-
117
-
118
 |
 |

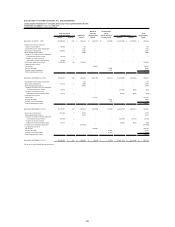
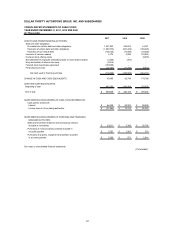
DOLLAR THRIFTY AUTOMOTIVE GROUP, INC. AND SUBSIDIARIES
CONSOLIDATED STATEMENTS OF STOCKHOLDERS' EQUITY AND COMPREHENSIVE INCOME
YEAR ENDED DECEMBER 31, 2011, 2010 AND 2009
(In Thousands Except Share and Per Share Data)
Retained Accumulated
Earnings Other Total
Additional (Accumulated Comprehensive Stockholders’
Shares Amount Capital Deficit) Income (Loss) Shares Amount Equity
BALANCE, JANUARY 1, 2009 28,039,658 280$ 803,304$ (338,207)$ (29,388)$ (6,414,906) (227,569)$ 208,420$
Issuance of common shares for
director compensation 49,995 1 531 - - - - 532
Tax benefit of stock option transactions - - 1,281 - - - - 1,281
Stock option transactions 136,500 1 2,289 - - - - 2,290
Share-based payment plans - - 4,698 - - - - 4,698
Issuance of common stock in settlement
of vested performance shares 64,190 1 - - - - - 1
Issuance of common stock in
settlement of vested restricted stock 48,508 - - - - - - -
Public stock offering, net of fees 6,612,500 66 120,590 - - - - 120,656
Comprehensive income:
Net income 45,022 45,022
Interest rate swap 8,662 8,662
Foreign currency translation 2,352 2,352
Total comprehensive income 56,036
BALANCE, DECEMBER 31, 2009 34,951,351 349 932,693 (293,185) (18,374) (6,414,906) (227,569) 393,914
Tax benefit of stock option transactions - - 381 - - - - 381
Stock option transactions 172,733 2 2,985 - - - - 2,987
Share-based payment plans - - 4,785 - - - - 4,785
Issuance of common stock in settlement
of vested performance shares 35,910 - - - - (11,818) (382) (382)
Issuance of common stock in
settlement of vested restricted stock 37,173 1 - - - (6,991) (340) (339)
Comprehensive income:
Net income 131,216 131,216
Interest rate swap 5,543 5,543
Foreign currency translation 502 502
Total comprehensive income 137,261
BALANCE, DECEMBER 31, 2010 35,197,167 352 940,844 (161,969) (12,329) (6,433,715) (228,291) 538,607
Stock option transactions 672,394 7 4,765 - - - - 4,772
Share-based payment plans - - 3,234 - - - - 3,234
Issuance of common stock in settlement
of vested performance shares 145,428 2 - - - (52,388) (2,747) (2,745)
Issuance of common stock in
settlement of vested restricted stock 33,617 - - - - (5,616) (458) (458)
Forward stock repurchase agreement - - (100,000) - - - - (100,000)
Comprehensive income:
Net income 159,550 159,550
Interest rate swap 10,259 10,259
Foreign currency translation (5,547) (5,547)
Total comprehensive income 164,262
BALANCE, DECEMBER 31, 2011 36,048,606 361$ 848,843$ (2,419)$ (7,617)$ (6,491,719) (231,496)$ 607,672$
See notes to consolidated financial statements.
Treasury Stock
Common Stock
$.01 Par Value
55