Thrifty Car Rental 2011 Annual Report Download - page 38
Download and view the complete annual report
Please find page 38 of the 2011 Thrifty Car Rental annual report below. You can navigate through the pages in the report by either clicking on the pages listed below, or by using the keyword search tool below to find specific information within the annual report.-
 1
1 -
2
-
3
-
4
-
5
-
6
-
7
-
8
-
9
-
10
-
11
-
12
-
13
-
14
-
15
-
16
-
17
-
18
-
19
-
20
-
21
-
22
-
23
-
24
-
25
-
26
-
27
-
 28
28 -
 29
29 -
 30
30 -
 31
31 -
 32
32 -
 33
33 -
 34
34 -
 35
35 -
 36
36 -
 37
37 -
 38
38 -
 39
39 -
 40
40 -
 41
41 -
 42
42 -
 43
43 -
 44
44 -
 45
45 -
 46
46 -
 47
47 -
 48
48 -
49
-
50
-
51
-
52
-
53
-
54
-
55
-
56
-
57
-
58
-
59
-
60
-
61
-
62
-
63
-
64
-
65
-
66
-
67
-
68
-
69
-
70
-
71
-
72
-
73
-
74
-
75
-
76
-
77
-
78
-
79
-
80
-
81
-
82
-
83
-
84
-
85
-
86
-
87
-
88
-
89
-
90
-
91
-
92
-
93
-
94
-
95
-
96
-
97
-
98
-
99
-
100
-
101
-
102
-
103
-
104
-
105
-
106
-
107
-
108
-
109
-
110
-
111
-
112
-
113
-
114
-
115
-
116
-
117
-
118
 |
 |

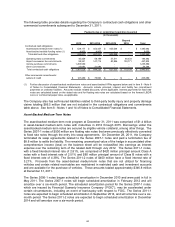
The Company’s revenues consist of:
• Vehicle rental revenue generated from renting vehicles and related ancillary products
and services sold to customers through company-owned stores, and
• Other revenue generated from leasing vehicles to franchisees, continuing franchise and
service fees, parking income and miscellaneous sources.
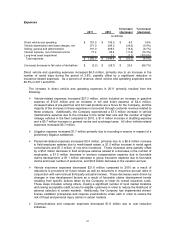
The Company’s expenses consist of:
• Direct vehicle and operating expense related to the rental of revenue-earning vehicles to
customers and the leasing of vehicles to franchisees,
• Vehicle depreciation and lease charges net of gains and losses on vehicle disposal,
• Selling, general and administrative expense, which primarily includes headquarters
personnel expenses, advertising and marketing expenses, most IT expenses and
administrative expenses,
• Interest expense, net, which includes interest expense on vehicle-related debt and non-
vehicle debt, net of interest earned on restricted and unrestricted cash, and
• Long-lived asset impairment relates to the write-off of software no longer in use and
property and equipment deemed to be impaired.
The Company’s (increase) decrease in fair value of derivatives consists of the changes in the fair
market value of its interest rate swap and cap agreements that did not qualify for hedge accounting
treatment.
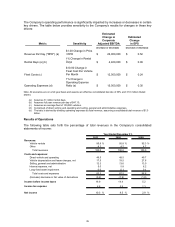
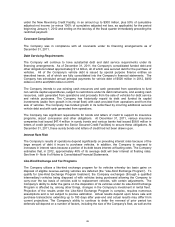
Year Ended December 31, 2011 Compared with Year Ended December 31, 2010
Revenues
$ Increase/ % Increase/
2011 2010 (decrease) (decrease)
Vehicle rentals 1,484.3$ 1,473.0$ 11.3$ 0.8%
Other 64.6 64.2 0.4 0.7%
Total revenues 1,548.9$ 1,537.2$ 11.7$ 0.8%
Vehicle rental metrics:
Average number of vehicles operated 107,154 102,291 4,863 4.8%
Average revenue per day $47.15 $48.55 ($1.40) (2.9%)
Number of rental days 31,482,339 30,338,815 1,143,524 3.8%
Vehicle utilization 80.5% 81.3% (0.8 ) p.p. N/M
(in millions)
Vehicle rental revenue for 2011 increased 0.8%. The Company experienced a 3.8% increase in
rental days totaling $55.4 million, partially offset by a 2.9% decrease in revenue per day totaling
$44.1 million.
36