Thrifty Car Rental 2011 Annual Report Download - page 51
Download and view the complete annual report
Please find page 51 of the 2011 Thrifty Car Rental annual report below. You can navigate through the pages in the report by either clicking on the pages listed below, or by using the keyword search tool below to find specific information within the annual report.-
 1
1 -
2
-
3
-
4
-
5
-
6
-
7
-
8
-
9
-
10
-
11
-
12
-
13
-
14
-
15
-
16
-
17
-
18
-
19
-
20
-
21
-
22
-
23
-
24
-
25
-
26
-
27
-
28
-
29
-
30
-
31
-
32
-
33
-
34
-
35
-
36
-
37
-
38
-
39
-
40
-
 41
41 -
 42
42 -
 43
43 -
 44
44 -
 45
45 -
 46
46 -
 47
47 -
 48
48 -
 49
49 -
 50
50 -
 51
51 -
 52
52 -
 53
53 -
 54
54 -
 55
55 -
 56
56 -
 57
57 -
 58
58 -
 59
59 -
 60
60 -
 61
61 -
62
-
63
-
64
-
65
-
66
-
67
-
68
-
69
-
70
-
71
-
72
-
73
-
74
-
75
-
76
-
77
-
78
-
79
-
80
-
81
-
82
-
83
-
84
-
85
-
86
-
87
-
88
-
89
-
90
-
91
-
92
-
93
-
94
-
95
-
96
-
97
-
98
-
99
-
100
-
101
-
102
-
103
-
104
-
105
-
106
-
107
-
108
-
109
-
110
-
111
-
112
-
113
-
114
-
115
-
116
-
117
-
118
 |
 |

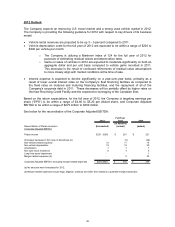
2012 Outlook
The Company expects an improving U.S. travel market and a strong used vehicle market in 2012.
The Company is providing the following guidance for 2012 with respect to key drivers of its business
model:
• Vehicle rental revenues are projected to be up 3 – 5 percent compared to 2011.
• Vehicle depreciation costs for the full year of 2012 are expected to be within a range of $220 to
$240 per vehicle per month.
o The Company is utilizing a Manheim index of 124 for the full year of 2012 for
purposes of estimating residual values and depreciation rates.
o Gains on sales of vehicles in 2012 are expected to moderate significantly on both an
aggregate dollar and per unit basis compared to vehicle gains recorded in 2011.
This decrease is the result of continued refinements of residual value assumptions
to more closely align with market conditions at the time of sale.
• Interest expense is expected to decline significantly on a year-over-year basis, primarily as a
result of lower overall interest rates on the Company’s fleet financing facilities as compared to
the fixed rates on matured and maturing financing facilities, and the repayment of all of the
Company’s corporate debt in 2011. These decreases will be partially offset by higher rates on
the New Revolving Credit Facility and the expected re-leveraging of the Canadian fleet.
Based on the above expectations, for the full year of 2012, the Company is targeting earnings per
share (“EPS”) to be within a range of $4.60 to $5.20 per diluted share, and Corporate Adjusted
EBITDA to be within a range of $275 million to $300 million.
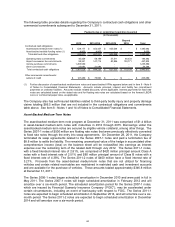
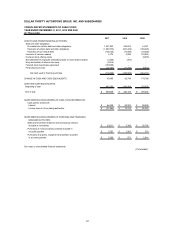
See below for the reconciliation of the Corporate Adjusted EBITDA:
Full Year
2012 2011 2010
(in millions)
Reconciliation of Pretax income to (forecasted) (actual) (actual)
Corporate Adjusted EBITDA
Pretax income $231 - $256 261$ 221$
(Increase) decrease in fair value of derivatives (a) - (3) (29)
Non-vehicle interest expense 10 11 10
Non-vehicle depreciation 19 19 20
Amortization 7 7 7
Non-cash stock incentives 8 3 5
Long-lived asset impairment - - 1
Merger-related expenses (b) - 5 23
Corporate Adjusted EBITDA, excluding merger-related expenses $275-$300 303$ 258$
(a) No amounts were forecasted for 2012.
(b) Merger-related expenses include legal, litigation, advisory and other fees related to a potential merger transaction.
49