Thrifty Car Rental 2011 Annual Report Download - page 42
Download and view the complete annual report
Please find page 42 of the 2011 Thrifty Car Rental annual report below. You can navigate through the pages in the report by either clicking on the pages listed below, or by using the keyword search tool below to find specific information within the annual report.-
 1
1 -
2
-
3
-
4
-
5
-
6
-
7
-
8
-
9
-
10
-
11
-
12
-
13
-
14
-
15
-
16
-
17
-
18
-
19
-
20
-
21
-
22
-
23
-
24
-
25
-
26
-
27
-
28
-
29
-
30
-
31
-
 32
32 -
 33
33 -
 34
34 -
 35
35 -
 36
36 -
 37
37 -
 38
38 -
 39
39 -
 40
40 -
 41
41 -
 42
42 -
 43
43 -
 44
44 -
 45
45 -
 46
46 -
 47
47 -
 48
48 -
 49
49 -
 50
50 -
 51
51 -
 52
52 -
53
-
54
-
55
-
56
-
57
-
58
-
59
-
60
-
61
-
62
-
63
-
64
-
65
-
66
-
67
-
68
-
69
-
70
-
71
-
72
-
73
-
74
-
75
-
76
-
77
-
78
-
79
-
80
-
81
-
82
-
83
-
84
-
85
-
86
-
87
-
88
-
89
-
90
-
91
-
92
-
93
-
94
-
95
-
96
-
97
-
98
-
99
-
100
-
101
-
102
-
103
-
104
-
105
-
106
-
107
-
108
-
109
-
110
-
111
-
112
-
113
-
114
-
115
-
116
-
117
-
118
 |
 |
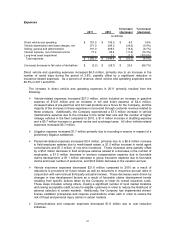
Significant fluctuations within direct vehicle and operating expense in 2010 primarily resulted
from the following:
Communications and computer expenses decreased $5.7 million due to cost reduction
initiatives.
Vehicle-related costs decreased $5.5 million. This decrease is due primarily to a decrease
in vehicle repairs and maintenance expense of $9.5 million, resulting from operating a newer
and slightly reduced average fleet in 2010 compared to 2009, a $5.4 million decrease in
vehicle insurance expenses primarily due to a change in insurance reserves resulting from
favorable developments in claim history and a $2.3 million decrease in net vehicle damages
resulting from improved damage recovery collections. The decreases were partially offset
by a $7.8 million increase in gasoline expense resulting primarily from higher average gas
prices, which is generally recovered in revenues from customers, and a $5.6 million increase
in vehicle tag and tax expense, which is also a result of operating a newer average fleet in
2010 compared to 2009.
Personnel-related expenses decreased $4.9 million. Approximately $3.5 million of the
decrease resulted from a reduction in the number of employees attributable to lower
transaction levels and continued cost efficiency initiatives, while the Company also realized a
$3.9 million decrease in group insurance expense due to favorable claims and reductions in
personnel. These decreases were partially offset by a $1.6 million increase in the vacation
accrual due to a related policy change beginning in 2010, coupled with a $0.9 million
increase in incentive compensation expense for 2010.
Bad debt expense decreased $3.3 million due to improved collection experience in 2010 and
the bankruptcy of one of the Company’s tour operators in 2009.
Facility and airport concession expenses decreased $1.8 million due to a decrease in rent
expense of $1.4 million, primarily due to company-owned store closures and a decrease in
concession fees of $0.4 million.
All other direct vehicle and operating expenses decreased $1.8 million.
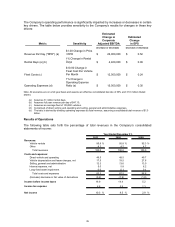
Net vehicle depreciation and lease charges decreased $126.9 million. As a percent of revenue, net
vehicle depreciation expense and lease charges were 19.5% in 2010, compared to 27.6% in 2009.
The decrease in net vehicle depreciation and lease charges resulted from the following:
Vehicle depreciation expense decreased $98.5 million, primarily resulting from a 19.8%
decrease in the average depreciation rate due to significantly improved conditions in the
used car market, extended vehicle holding periods, fleet consisting of various vehicle
manufacturers and of more diversified vehicle types, and process improvements made by
the Company in vehicle remarketing practices, coupled with a 2.0% decrease in the average
depreciable fleet.
Net vehicle gains on disposal of risk vehicles (reductions to net vehicle depreciation and
lease charges), which effectively represent revisions to previous estimates of vehicle
depreciation charges by reducing vehicle depreciation and lease charges, increased $28.0
million from a $35.1 million gain in 2009 to a $63.1 million gain in 2010. This increase in
gains on vehicle dispositions resulted from more units sold during 2010 and a higher
average gain per unit as compared to 2009, attributable to a stronger resale market in 2010
compared to 2009.
Lease charges for vehicles leased from third parties decreased $0.4 million in 2010.
40