Thrifty Car Rental 2011 Annual Report Download - page 65
Download and view the complete annual report
Please find page 65 of the 2011 Thrifty Car Rental annual report below. You can navigate through the pages in the report by either clicking on the pages listed below, or by using the keyword search tool below to find specific information within the annual report.-
 1
1 -
2
-
3
-
4
-
5
-
6
-
7
-
8
-
9
-
10
-
11
-
12
-
13
-
14
-
15
-
16
-
17
-
18
-
19
-
20
-
21
-
22
-
23
-
24
-
25
-
26
-
27
-
28
-
29
-
30
-
31
-
32
-
33
-
34
-
35
-
36
-
37
-
38
-
39
-
40
-
41
-
42
-
43
-
44
-
45
-
46
-
47
-
48
-
49
-
50
-
51
-
52
-
53
-
54
-
 55
55 -
 56
56 -
 57
57 -
 58
58 -
 59
59 -
 60
60 -
 61
61 -
 62
62 -
 63
63 -
 64
64 -
 65
65 -
 66
66 -
 67
67 -
 68
68 -
 69
69 -
 70
70 -
 71
71 -
 72
72 -
 73
73 -
 74
74 -
 75
75 -
76
-
77
-
78
-
79
-
80
-
81
-
82
-
83
-
84
-
85
-
86
-
87
-
88
-
89
-
90
-
91
-
92
-
93
-
94
-
95
-
96
-
97
-
98
-
99
-
100
-
101
-
102
-
103
-
104
-
105
-
106
-
107
-
108
-
109
-
110
-
111
-
112
-
113
-
114
-
115
-
116
-
117
-
118
 |
 |

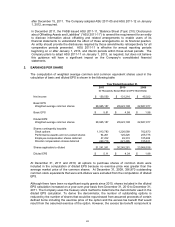
after December 15, 2011. The Company adopted ASU 2011-05 and ASU 2011-12 on January
1, 2012, as required.
In December 2011, the FASB issued ASU 2011-11, “Balance Sheet (Topic 210): Disclosures
about Offsetting Assets and Liabilities” (“ASU 2011-11”) to amend the requirement for an entity
to disclose information about offsetting and related arrangements to enable users of its
financial statements to understand the effect of those arrangements on its financial position.
An entity should provide the disclosures required by those amendments retrospectively for all
comparative periods presented. ASU 2011-11 is effective for annual reporting periods
beginning on or after January 1, 2013, and interim periods within those annual periods. The
Company plans to adopt ASU 2011-11 on January 1, 2013, as required, but does not believe
this guidance will have a significant impact on the Company’s consolidated financial
statements.
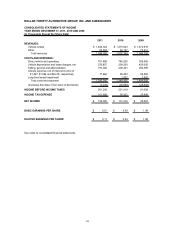
2. EARNINGS PER SHARE
The computation of weighted average common and common equivalent shares used in the
calculation of basic and diluted EPS is shown in the following table:
2011 2010 2009
(In Thousands, Except Share and Per Share Data)
Net income 159,550$ 131,216$ 45,022$
Basic EPS:
Weighted average common shares 28,965,187 28,623,108 22,687,077
Basic EPS 5.51$ 4.58$ 1.98$
Diluted EPS:
Weighted average common shares 28,965,187 28,623,108 22,687,077
Shares contingently issuable:
Stock options 1,913,783 1,226,089 762,673
Performance awards and non-vested shares 94,261 125,225 255,775
Employee compensation shares deferred 47,232 49,374 105,402
Director compensation shares deferred 220,778 221,485 155,611
Shares applicable to diluted 31,241,241 30,245,281 23,966,538
Diluted EPS 5.11$ 4.34$ 1.88$
Y
ear Ended December 31,
At December 31, 2011 and 2010, all options to purchase shares of common stock were
included in the computation of diluted EPS because no exercise price was greater than the
average market price of the common shares. At December 31, 2009, 356,970 outstanding
common stock equivalents that were anti-dilutive were excluded from the computation of diluted
EPS.
Although there have been no significant equity grants since 2010, shares included in the diluted
EPS calculation increased on a year-over-year basis from December 31, 2010 to December 31,
2011. The Company uses the treasury stock method to determine the denominator used in the
diluted EPS calculation. To derive the denominator, the number of outstanding options is
reduced by the number of shares that would be repurchased from assumed proceeds of certain
defined items including the exercise price of the option and the excess tax benefit that would
result from the assumed exercise of the option. However, the excess tax benefit component is
63