Thrifty Car Rental 2011 Annual Report Download - page 67
Download and view the complete annual report
Please find page 67 of the 2011 Thrifty Car Rental annual report below. You can navigate through the pages in the report by either clicking on the pages listed below, or by using the keyword search tool below to find specific information within the annual report.-
 1
1 -
2
-
3
-
4
-
5
-
6
-
7
-
8
-
9
-
10
-
11
-
12
-
13
-
14
-
15
-
16
-
17
-
18
-
19
-
20
-
21
-
22
-
23
-
24
-
25
-
26
-
27
-
28
-
29
-
30
-
31
-
32
-
33
-
34
-
35
-
36
-
37
-
38
-
39
-
40
-
41
-
42
-
43
-
44
-
45
-
46
-
47
-
48
-
49
-
50
-
51
-
52
-
53
-
54
-
55
-
56
-
 57
57 -
 58
58 -
 59
59 -
 60
60 -
 61
61 -
 62
62 -
 63
63 -
 64
64 -
 65
65 -
 66
66 -
 67
67 -
 68
68 -
 69
69 -
 70
70 -
 71
71 -
 72
72 -
 73
73 -
 74
74 -
 75
75 -
 76
76 -
 77
77 -
78
-
79
-
80
-
81
-
82
-
83
-
84
-
85
-
86
-
87
-
88
-
89
-
90
-
91
-
92
-
93
-
94
-
95
-
96
-
97
-
98
-
99
-
100
-
101
-
102
-
103
-
104
-
105
-
106
-
107
-
108
-
109
-
110
-
111
-
112
-
113
-
114
-
115
-
116
-
117
-
118
 |
 |

and has an annual vehicle purchase agreement with General Motors Company covering vehicle
purchases through the 2012 model year. See Note 14 for the amount of outstanding vehicle
purchase commitments.
The Company acquires both Program and Non-Program Vehicles from various manufacturers
and receives payments under its various supplier agreements for promotional payments,
incentives primarily related to the disposal of revenue-earning vehicles and interest
reimbursement for Program Vehicles while at auction and for certain delivery related interest
costs. The aggregate amount of payments recognized from manufacturers for guaranteed
residual value program payments, buyback or repurchase payments, promotional payments,
interest reimbursement and other incentives, other than recovery costs, totaled $180.5 million,
$175.6 million and $524.4 million in 2011, 2010 and 2009, respectively, of which a substantial
portion of the payments relate to the guaranteed residual value or manufacturer buyback
programs. The outstanding balances at year-end are included in Vehicle Manufacturer
Receivables within Receivables, net on the consolidated balance sheet.
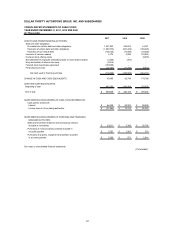
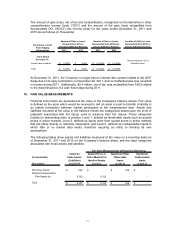
5. VEHICLE DEPRECIATION AND LEASE CHARGES, NET
Vehicle depreciation and lease charges include the following:
2011 2010 2009
Depreciation of revenue-earning vehicles and other 317,844$ 362,284$ 461,178$
Net gains from disposal of revenue-earning vehicles (46,887) (63,084) (35,086)
270,957$ 299,200$ 426,092$
Year Ended December 31,
(In Thousands)
Average gain on Non-Program Vehicles:
2011 2010 2009
Number of Non-Program Vehicles sold 39,398 57,100 50,099
Average gain on vehicles sold (per vehicle) 1,190$ 1,105$ 700$
Year Ended December 31,
Components of vehicle depreciation per vehicle per month:
2011 2010 2009
Average depreciable fleet (units) 108,127 103,207 105,301
Average depreciation rate 245$ 293$ 365$
Average gain on vehicles sold (36) (51) (28)
Average vehicle depreciation and lease charges, net 209$ 242$ 337$
Year Ended December 31,
Depreciation expense for Non-Program Vehicles, which constitute substantially all of the
Company’s fleet, is recorded on a straight-line basis over the life of the vehicle, based on the
original acquisition cost, the projected residual value at the time of sale, and the estimated length
of time the vehicle will be held in service. The Company’s vehicle depreciation rates will be
65