Starwood 2006 Annual Report Download - page 99
Download and view the complete annual report
Please find page 99 of the 2006 Starwood annual report below. You can navigate through the pages in the report by either clicking on the pages listed below, or by using the keyword search tool below to find specific information within the annual report.-
 1
1 -
2
-
3
-
4
-
5
-
6
-
7
-
8
-
9
-
10
-
11
-
12
-
13
-
14
-
15
-
16
-
17
-
18
-
19
-
20
-
21
-
22
-
23
-
24
-
25
-
26
-
27
-
28
-
29
-
30
-
31
-
32
-
33
-
34
-
35
-
36
-
37
-
38
-
39
-
40
-
41
-
42
-
43
-
44
-
45
-
46
-
47
-
48
-
49
-
50
-
51
-
52
-
53
-
54
-
55
-
56
-
57
-
58
-
59
-
60
-
61
-
62
-
63
-
64
-
65
-
66
-
67
-
68
-
69
-
70
-
71
-
72
-
73
-
74
-
75
-
76
-
77
-
78
-
79
-
80
-
81
-
82
-
83
-
84
-
85
-
86
-
87
-
88
-
 89
89 -
 90
90 -
 91
91 -
 92
92 -
 93
93 -
 94
94 -
 95
95 -
 96
96 -
 97
97 -
 98
98 -
 99
99 -
 100
100 -
 101
101 -
 102
102 -
 103
103 -
 104
104 -
 105
105 -
 106
106 -
 107
107 -
 108
108 -
 109
109 -
110
-
111
-
112
-
113
-
114
-
115
 |
 |

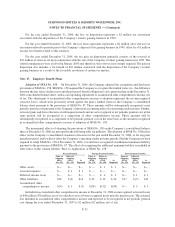
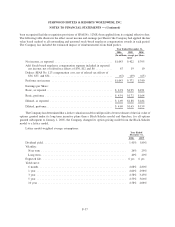
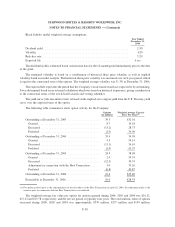
Black Scholes model weighted average assumptions:
Year Ended
December 31,
2004
Dividend yield ...................................................... 2.5%
Volatility .......................................................... 42%
Risk-free rate ....................................................... 3.2%
Expected life ....................................................... 6yrs
The dividend yield is estimated based on historical data for the 12-month period immediately prior to the date
of the grant.
The estimated volatility is based on a combination of historical share price volatility as well as implied
volatility based on market analysis. The historical share price volatility was measured over an 8-year period, which
is equal to the contractual term of the options. The weighted average volatility was 31.3% at December 31, 2006.
The expected life represents the period that the Company’s stock-based awards are expected to be outstanding.
It was determined based on an actuarial calculation which was based on historical experience, giving consideration
to the contractual terms of the stock-based awards and vesting schedules.
The yield curve (risk-free interest rate) is based on the implied zero-coupon yield from the U.S. Treasury yield
curve over the expected term of the option.
The following table summarizes stock option activity for the Company:
Options
(in millions)
Weighted Average Exercise
Price Per Share
(1)
Outstanding at December 31, 2003 .................... 39.3 $32.01
Granted ....................................... 8.7 39.18
Exercised ..................................... (13.2) 28.73
Forfeited ...................................... (1.4) 36.90
Outstanding at December 31, 2004 .................... 33.4 34.98
Granted ....................................... 4.5 59.14
Exercised ..................................... (11.1) 36.63
Forfeited ...................................... (1.9) 41.57
Outstanding at December 31, 2005 .................... 24.9 38.09
Granted ....................................... 2.4 59.55
Exercised ..................................... (12.3) 30.74
Adjustment in connection with the Host Transaction ...... 5.0 33.26
Forfeited ...................................... (0.8) 40.87
Outstanding at December 31, 2006 .................... 19.2 $35.40
Exercisable at December 31, 2006 ..................... 10.0 $28.93
(1) For option activity prior to the consummation of the first phase of the Host Transaction on April 10, 2006, the adjustment made to the
exercise price in connection with the Host Transaction is not reflected.
The weighted-average fair value per option for options granted during 2006, 2005 and 2004 was $16.12,
$17.23 and $13.78, respectively, and the service period is typically four years. The total intrinsic value of options
exercised during 2006, 2005 and 2004 was approximately $370 million, $257 million and $199 million,
F-38
STARWOOD HOTELS & RESORTS WORLDWIDE, INC.
NOTES TO FINANCIAL STATEMENTS — (Continued)