Starwood 2006 Annual Report Download - page 33
Download and view the complete annual report
Please find page 33 of the 2006 Starwood annual report below. You can navigate through the pages in the report by either clicking on the pages listed below, or by using the keyword search tool below to find specific information within the annual report.-
 1
1 -
2
-
3
-
4
-
5
-
6
-
7
-
8
-
9
-
10
-
11
-
12
-
13
-
14
-
15
-
16
-
17
-
18
-
19
-
20
-
21
-
22
-
 23
23 -
 24
24 -
 25
25 -
 26
26 -
 27
27 -
 28
28 -
 29
29 -
 30
30 -
 31
31 -
 32
32 -
 33
33 -
 34
34 -
 35
35 -
 36
36 -
 37
37 -
 38
38 -
 39
39 -
 40
40 -
 41
41 -
 42
42 -
 43
43 -
44
-
45
-
46
-
47
-
48
-
49
-
50
-
51
-
52
-
53
-
54
-
55
-
56
-
57
-
58
-
59
-
60
-
61
-
62
-
63
-
64
-
65
-
66
-
67
-
68
-
69
-
70
-
71
-
72
-
73
-
74
-
75
-
76
-
77
-
78
-
79
-
80
-
81
-
82
-
83
-
84
-
85
-
86
-
87
-
88
-
89
-
90
-
91
-
92
-
93
-
94
-
95
-
96
-
97
-
98
-
99
-
100
-
101
-
102
-
103
-
104
-
105
-
106
-
107
-
108
-
109
-
110
-
111
-
112
-
113
-
114
-
115
 |
 |

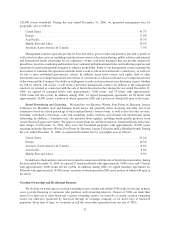
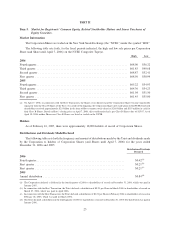
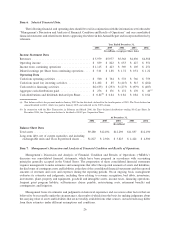
Item 6. Selected Financial Data.
The following financial and operating data should be read in conjunction with the information set forth under
“Management’s Discussion and Analysis of Financial Condition and Results of Operations” and our consolidated
financial statements and related notes thereto appearing elsewhere in this Annual Report and incorporated herein by
reference.
2006 2005 2004 2003 2002
Year Ended December 31,
(In millions, except per Share data)
Income Statement Data
Revenues ..................................... $5,979 $5,977 $5,368 $4,630 $4,588
Operating income ............................... $ 839 $ 822 $ 653 $ 427 $ 551
Income from continuing operations .................. $1,115 $ 423 $ 369 $ 105 $ 251
Diluted earnings per Share from continuing operations .... $ 5.01 $ 1.88 $ 1.72 $ 0.51 $ 1.22
Operating Data
Cash from operating activities ...................... $ 500 $ 764 $ 578 $ 766 $ 759
Cash from (used for) investing activities............... $1,402 $ 85 $ (415) $ 515 $ (282)
Cash used for financing activities .................... $(2,635) $ (253) $ (273) $ (979) $ (487)
Aggregate cash distributions paid .................... $ 276 $ 176 $ 172 $ 170 $ 40
(a)
Cash distributions and dividends declared per Share ...... $ 0.84
(b)
$ 0.84 $ 0.84 $ 0.84 $ 0.84
(a) This balance reflects the payment made in January 2002 for the dividends declared for the fourth quarter of 2001. The Trust declared an
annual dividend in 2002, which was paid in January 2003 and reflected in the 2003 column.
(b) In connection with the Host Transaction, in February and March 2006, the Trust declared distributions totaling $0.42 per Share. In
December 2006, the Corporation declared a dividend of $0.42 per Corporation Share.
2006 2005 2004 2003 2002
At December 31,
(In millions)
Balance Sheet Data
Total assets ................................. $9,280 $12,494 $12,298 $11,857 $12,190
Long-term debt, net of current maturities and including
exchangeable units and Class B preferred shares .... $1,827 $ 2,926 $ 3,823 $ 4,424 $ 4,500
Item 7. Management’s Discussion and Analysis of Financial Condition and Results of Operations.
Management’s Discussion and Analysis of Financial Condition and Results of Operations (“MD&A”)
discusses our consolidated financial statements, which have been prepared in accordance with accounting
principles generally accepted in the United States. The preparation of these consolidated financial statements
requires management to make estimates and assumptions that affect the reported amounts of assets and liabilities,
the disclosure of contingent assets and liabilities at the date of the consolidated financial statements and the reported
amounts of revenues and costs and expenses during the reporting periods. On an ongoing basis, management
evaluates its estimates and judgments, including those relating to revenue recognition, bad debts, inventories,
investments, plant, property and equipment, goodwill and intangible assets, income taxes, financing operations,
frequent guest program liability, self-insurance claims payable, restructuring costs, retirement benefits and
contingencies and litigation.
Management bases its estimates and judgments on historical experience and on various other factors that are
believed to be reasonable under the circumstances, the results of which form the basis for making judgments about
the carrying value of assets and liabilities that are not readily available from other sources. Actual results may differ
from these estimates under different assumptions and conditions.
26