Starwood 2006 Annual Report Download - page 25
Download and view the complete annual report
Please find page 25 of the 2006 Starwood annual report below. You can navigate through the pages in the report by either clicking on the pages listed below, or by using the keyword search tool below to find specific information within the annual report.-
 1
1 -
2
-
3
-
4
-
5
-
6
-
7
-
8
-
9
-
10
-
11
-
12
-
13
-
14
-
 15
15 -
 16
16 -
 17
17 -
 18
18 -
 19
19 -
 20
20 -
 21
21 -
 22
22 -
 23
23 -
 24
24 -
 25
25 -
 26
26 -
 27
27 -
 28
28 -
 29
29 -
 30
30 -
 31
31 -
 32
32 -
 33
33 -
 34
34 -
 35
35 -
36
-
37
-
38
-
39
-
40
-
41
-
42
-
43
-
44
-
45
-
46
-
47
-
48
-
49
-
50
-
51
-
52
-
53
-
54
-
55
-
56
-
57
-
58
-
59
-
60
-
61
-
62
-
63
-
64
-
65
-
66
-
67
-
68
-
69
-
70
-
71
-
72
-
73
-
74
-
75
-
76
-
77
-
78
-
79
-
80
-
81
-
82
-
83
-
84
-
85
-
86
-
87
-
88
-
89
-
90
-
91
-
92
-
93
-
94
-
95
-
96
-
97
-
98
-
99
-
100
-
101
-
102
-
103
-
104
-
105
-
106
-
107
-
108
-
109
-
110
-
111
-
112
-
113
-
114
-
115
 |
 |

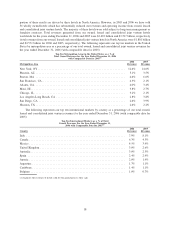
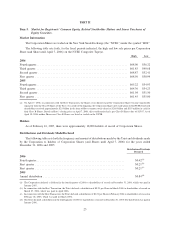
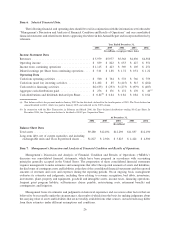
portion of these results are driven by these hotels in North America. However, in 2005 and 2006 we have sold
56 wholly owned hotels which has substantially reduced our revenues and operating income from owned, leased
and consolidated joint venture hotels. The majority of these hotels were sold subject to long-term management or
franchise contracts. Total revenues generated from our owned, leased and consolidated joint venture hotels
worldwide for the years ending December 31, 2006 and 2005 were $2.692 billion and $3.517 billion, respectively
(total revenues from our owned, leased and consolidated joint venture hotels in North America were $1.881 billion
and $2.571 billion for 2006 and 2005, respectively). The following represents our top ten markets in the United
States by metropolitan area as a percentage of our total owned, leased and consolidated joint venture revenues for
the year ended December 31, 2006 (with comparable data for 2005):
Metropolitan Area
2006
Revenues
2005
Revenues
Top Ten Metropolitan Areas in the United States as a % of
Total Owned Revenues for the Year Ended December 31, 2006
with Comparable Data for 2005
(1)
New York, NY ........................................................ 12.6% 14.6%
Phoenix, AZ ......................................................... 5.1% 3.5%
Boston, MA ......................................................... 4.6% 6.6%
San Francisco, CA..................................................... 4.3% 2.1%
Atlanta, GA.......................................................... 4.0% 3.4%
Maui, HI ............................................................ 3.8% 2.7%
Chicago, IL .......................................................... 3.2% 2.1%
Los Angeles-Long Beach, CA ............................................ 2.8% 3.8%
San Diego, CA ....................................................... 2.6% 3.9%
Houston, TX ......................................................... 2.6% 2.2%
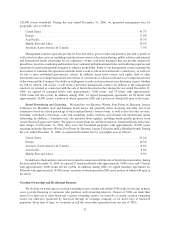
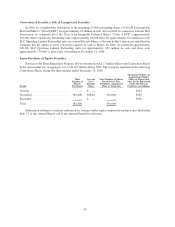
The following represents our top ten international markets by country as a percentage of our total owned,
leased and consolidated joint venture revenues for the year ended December 31, 2006 (with comparable data for
2005):
Country
2006
Revenues
2005
Revenues
Top Ten International Markets as a % of Total
Owned Revenues For the Year Ended December 31,
2006 with Comparable Data for 2005
(1)
Italy ............................................................... 7.9% 8.1%
Canada ............................................................. 6.3% 4.3%
Mexico ............................................................. 4.5% 3.4%
United Kingdom ...................................................... 3.0% 2.6%
Australia ............................................................ 3.0% 2.3%
Spain .............................................................. 2.4% 2.9%
Austria ............................................................. 2.0% 1.4%
Argentina ........................................................... 1.7% 1.1%
Caribbean ........................................................... 1.4% 1.1%
Belgium ............................................................ 1.0% 0.7%
(1) Includes the revenues of hotels sold for the period prior to their sale.
18