Starwood 2006 Annual Report Download - page 98
Download and view the complete annual report
Please find page 98 of the 2006 Starwood annual report below. You can navigate through the pages in the report by either clicking on the pages listed below, or by using the keyword search tool below to find specific information within the annual report.-
 1
1 -
2
-
3
-
4
-
5
-
6
-
7
-
8
-
9
-
10
-
11
-
12
-
13
-
14
-
15
-
16
-
17
-
18
-
19
-
20
-
21
-
22
-
23
-
24
-
25
-
26
-
27
-
28
-
29
-
30
-
31
-
32
-
33
-
34
-
35
-
36
-
37
-
38
-
39
-
40
-
41
-
42
-
43
-
44
-
45
-
46
-
47
-
48
-
49
-
50
-
51
-
52
-
53
-
54
-
55
-
56
-
57
-
58
-
59
-
60
-
61
-
62
-
63
-
64
-
65
-
66
-
67
-
68
-
69
-
70
-
71
-
72
-
73
-
74
-
75
-
76
-
77
-
78
-
79
-
80
-
81
-
82
-
83
-
84
-
85
-
86
-
87
-
 88
88 -
 89
89 -
 90
90 -
 91
91 -
 92
92 -
 93
93 -
 94
94 -
 95
95 -
 96
96 -
 97
97 -
 98
98 -
 99
99 -
 100
100 -
 101
101 -
 102
102 -
 103
103 -
 104
104 -
 105
105 -
 106
106 -
 107
107 -
 108
108 -
109
-
110
-
111
-
112
-
113
-
114
-
115
 |
 |

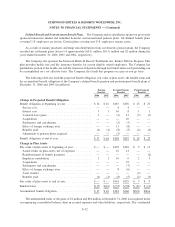
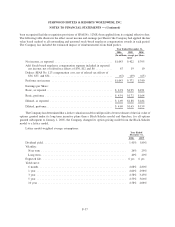
been recognized had the recognition provisions of SFAS No. 123(R) been applied from its original effective date.
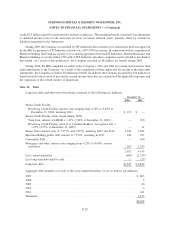
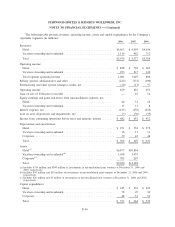
The following table illustrates the effect on net income and earnings per Share if the Company had applied the fair
value based method to all outstanding and unvested stock-based employee compensation awards in each period.
The Company has included the estimated impact of reimbursements from third parties.
2006 2005 2004
Year Ended December 31,
(In millions, except per Share
data)
Net income, as reported ..................................... $1,043 $ 422 $ 395
Add: Stock-based employee compensation expense included in reported
net income, net of related tax effects of $36, $12 and $6 ........... 67 19 10
Deduct: SFAS No. 123 compensation cost, net of related tax effects of
$36, $37, and $34 . ....................................... (67) (69) (65)
Proforma net income ....................................... $1,043 $ 372 $ 340
Earnings per Share:
Basic, as reported . . . ....................................... $ 4.91 $1.95 $1.91
Basic, proforma ........................................... $ 4.91 $1.72 $1.64
Diluted, as reported . ....................................... $ 4.69 $1.88 $1.84
Diluted, proforma . . . ....................................... $ 4.69 $1.65 $1.59
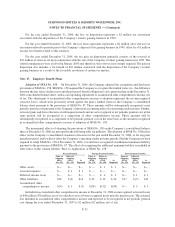
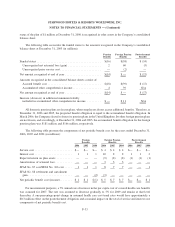
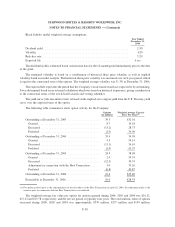
The Company has determined that a lattice valuation model would provide a better estimate of the fair value of
options granted under its long-term incentive plans than a Black-Scholes model and therefore, for all options
granted subsequent to January 1, 2005, the Company changed its option pricing model from the Black-Scholes
model to a lattice model.
Lattice model weighted average assumptions:
2006 2005
Year Ended
December 31,
Dividend yield . .................................................... 1.41% 1.80%
Volatility:
Near term . . .................................................... 26% 25%
Long term . . .................................................... 40% 40%
Expected life . . .................................................... 6yrs 6yrs
Yield curve:
6 month ........................................................ 4.68% 2.80%
1 year ......................................................... 4.66% 2.98%
3 year ......................................................... 4.58% 3.45%
5 year ......................................................... 4.53% 3.66%
10 year ........................................................ 4.58% 4.08%
F-37
STARWOOD HOTELS & RESORTS WORLDWIDE, INC.
NOTES TO FINANCIAL STATEMENTS — (Continued)